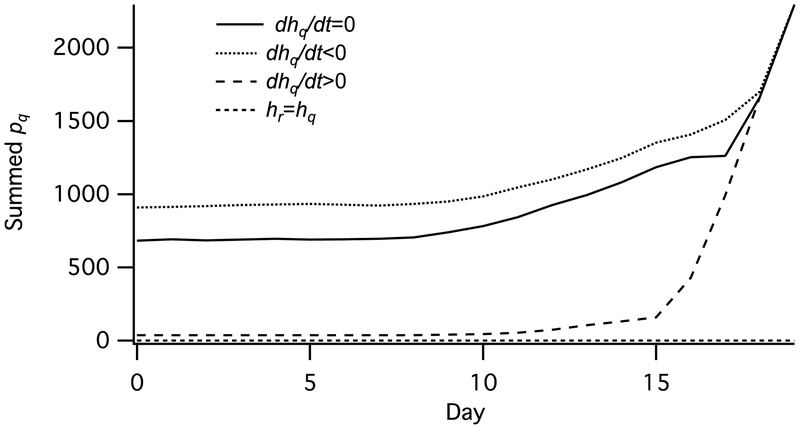
Fig. 3.
Tick questing behavior in relation to expected host encounter probability. Curves show the summed pq(t) values (the proportion of day t spent questing) for all state combinations on each day for a constant, increasing and decreasing probability of encountering a host while questing, as well as for when the probability of encountering a host while resting is equal to that while questing. hq and hr are the probabilities of encountering a host while questing and resting, respectively, held constant for all t; dhq/dt is the rate of change in hq over time. For dhq/dt=0, hq=0.001 and hr= 0; for dhq/dt>0, hq=5.5E-06+5.5E-06t and hr= 0; for dhq/dt<0 hq=0.001-5.5E-06t and hr= 0; for hr=hq hq=0.001 and hr= 0.001.

