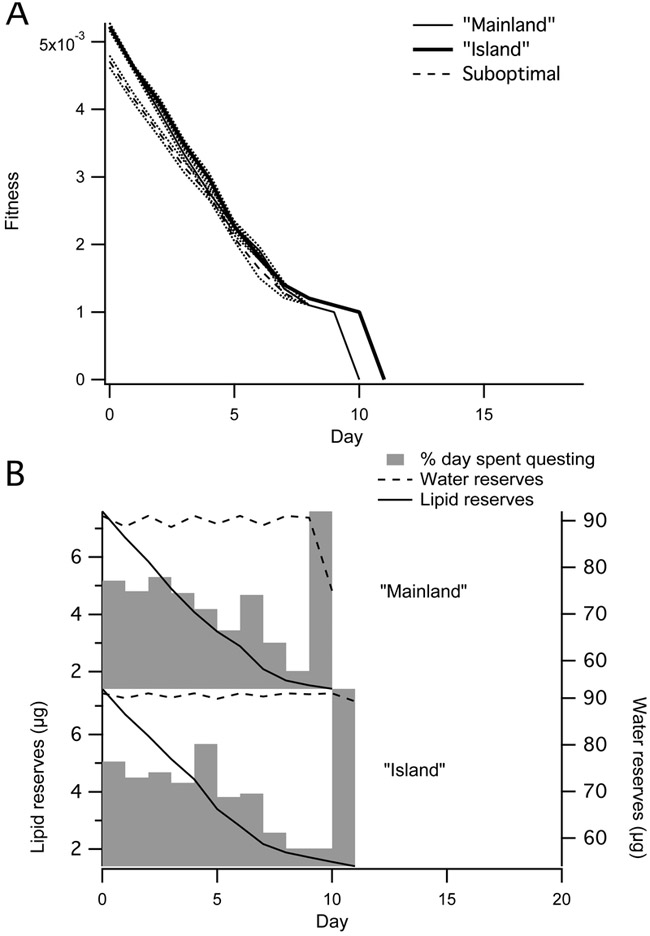
Fig. 6.
Comparison of “Island,” “Mainland,” and suboptimal (“Island” to “Mainland”) climate scenarios. The dynamic programming equation was run stochastically 10 times and averaged over a 20 day season. Plots represent a forward simulation along this averaged result, with deterministic tick energy and water state variable equations. Each individual nymph trajectory ends when a tick has reached a lipid or water boundary condition. (A) Plot of fitness scores over season (starting parameters x = 7.6 μg, w = 91 μg, where x refers to lipid reserves and w to water reserves). (Note that the “Mainland” trace is obscured by the suboptimal trace at points.) (B) Percentage of time spent questing (gray bars), lipid reserves (solid lines), and water reserves (dashed lines) by day for a tick under each scenario (starting parameters x = 7.6 μg, w = 60 μg). Bars representing the percentage of the day spent questing are scaled so that 0% aligns with xmin and wmin and 100% is even with xstart and wmax, where xmin and xstart are the tick’s minimum and starting lipid reserves, respectively, and wmin and wmax are the tick’s minimum and maximum water reserves.

