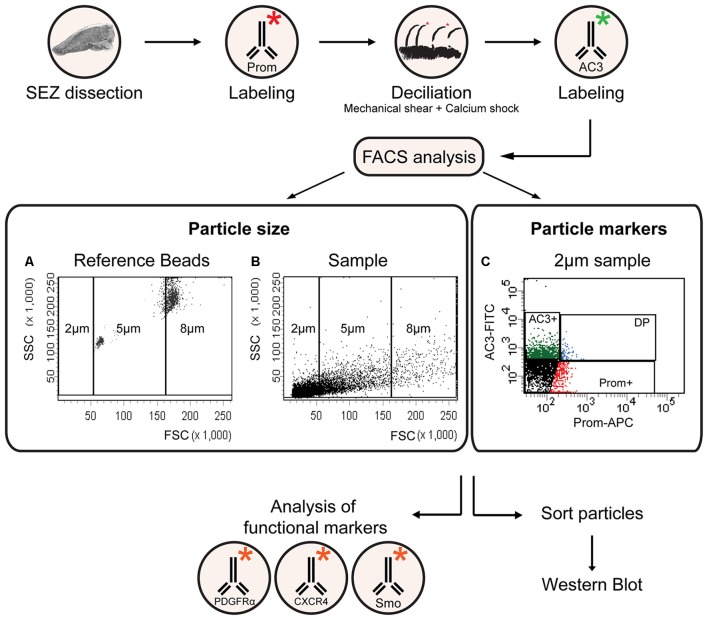
Figure 1.
A flow cytometric approach for the isolation and characterization of primary and motile cilia. Flowchart of the experimental procedure for cilia identification and characterization according to size and marker expression. The * symbol represents a conjugated fluorophore. (A,B) FACS plots showing the distribution of reference beads and a sample of cilia according to forward (FSC) and side (SSC) scatter. (C) Representative FACS plot illustrating the distribution of 2 μm particles upon immunostaining with antibodies directed against adenylate cyclase type iii (AC3; AC3-FITC) and prominin-1 (Prom-APC). The gates indicate AC3 positive (AC3+), Prominin positive (Prom+) and double positive (DP) particles.

