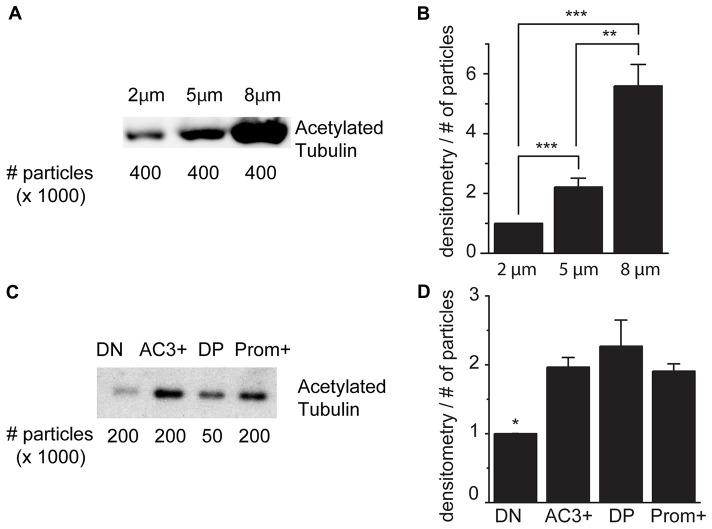
Figure 4.
Acetylated tubulin expression in sorted cilia. (A) Representative immunoblot analysis of acetylated tubulin in samples of sorted particles of different sizes from adult mice. (B) Densitometric analysis of four independent experiments. (C) Immunoblot analysis of acetylated tubulin in samples sorted according to the expression of AC3 and prominin-1: double negative (DN), AC3+ only (AC3+), double positive (DP), prominin-1 only (Prom+). (D) Densitometric analysis of three independent experiments normalized for the number of particles. Values represent the fold increase relative to the fist sample. Error bars represent SEM. Statistically significant differences are indicated with asterisks (*p < 0.05, **p < 0.01, ***p < 0.001).

