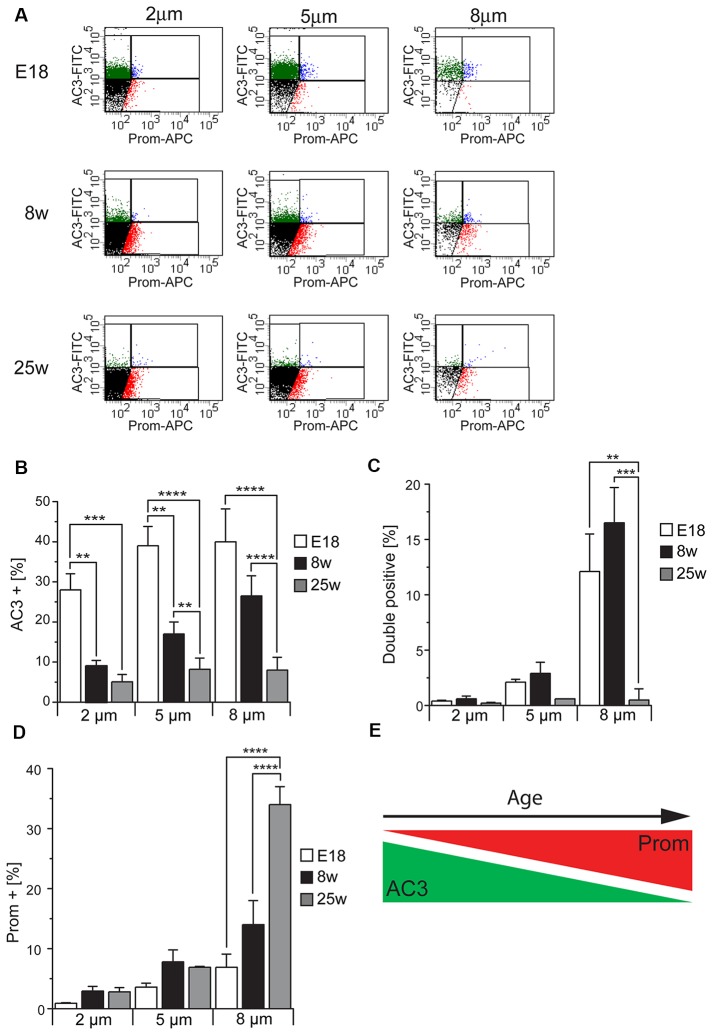
Figure 5.
Cilia characterization according to the expression of AC3 and prominin-1 in different mouse ages. (A) Representative FACS plots illustrating the distribution of particles of different sizes according to AC3 and prominin-1 (Prom) staining in E18 embryos, 8 week-old (8w) and 25 week-old (25w) mice. (B–D) Quantification of AC3+, DP and Prom+ particles in at least three independent experiments. Values represent the average percentage of particles in each population. Error bars represent SEM. Statistically significant differences are indicated with asterisks (**p < 0.01, ***p < 0.001, ****p < 0.0005). (E) Schematic representing the relative expression of AC3 and Prom across ages.

