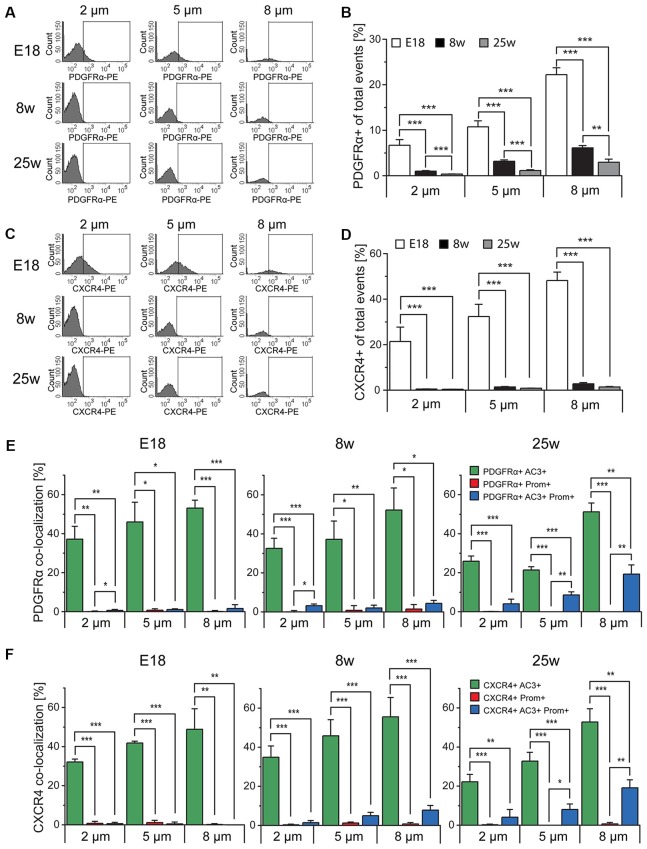
Figure 6.
Platelet-derived growth factor receptor α (PDGFRα) and CXC chemokine receptor 4 (CXCR4) expression in primary cilia. (A,C) FACS histograms depicting PDGFRα and CXCR4 total expression in particles of different size in E18 embryos (E18), 8 week-old (8w)- and 25 week-old (25w) mice. The gates include PDGFRα-PE or CXCR4-PE positive particles. (B,D) Quantification of the average percentage of PDGFRα+ and CXCR4+ particles in at least three independent experiments. (E,F) Quantitative analysis of the co-localization of PDGFRα and CXCR4 with AC3 (green bars), prominin-1 (Prom; red bars) and both AC3 and Prom (blue bars), as percentage of PDGFRα+ or CXCR4+ total particles. Values represent the average percentage of particles in each population. Error bars represent SEM. Statistically significant differences are indicated with asterisk (*p < 0.05, **p < 0.01, ***p < 0.001).

