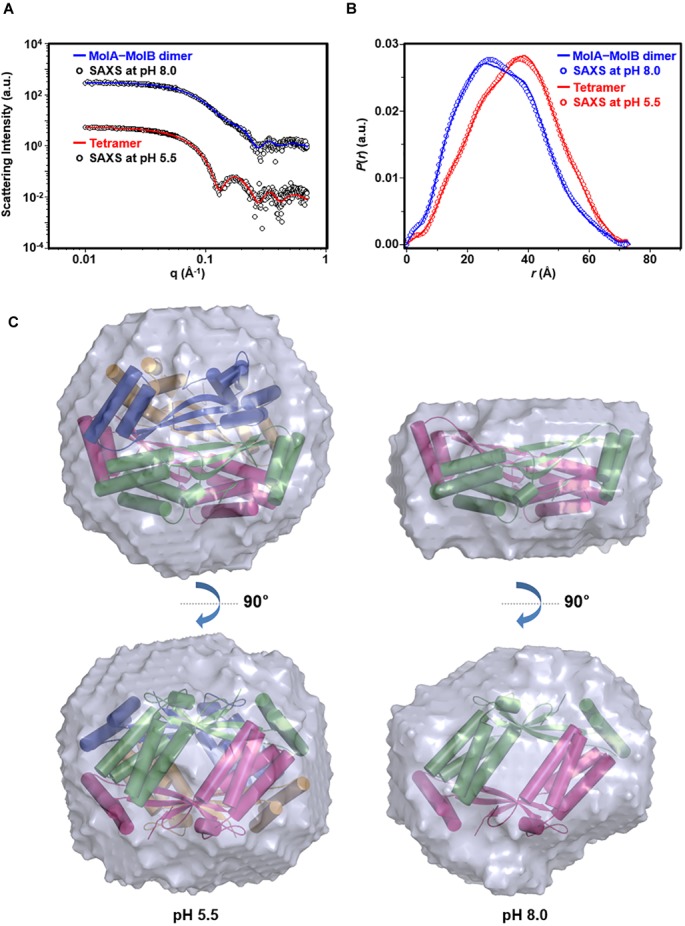
FIGURE 5.

SAXS analysis of st_YfdX. (A) X-ray scattering profiles in solution measured at 4°C. Circles indicate experimental data, whereas solid lines represent the theoretical SAXS curve calculated from the tetrameric (χ2 = 0.583) and dimeric (χ2 = 0.483) models shown in Figure 4C using the program CRYSOL. For clarity, each plot is shifted along the log I(q) axis. (B) Pair distance distribution p(r) functions in aqueous solution that were acquired by analyzing the experimental SAXS data using the program GNOM. Areas under curves were normalized to equal areas for ease of comparison. (C) The tetrameric (left) and dimeric (right) models of st_YfdX were docked into the reconstructed SAXS envelopes that were reconstructed as described in detail in Section “Materials and Methods.”
