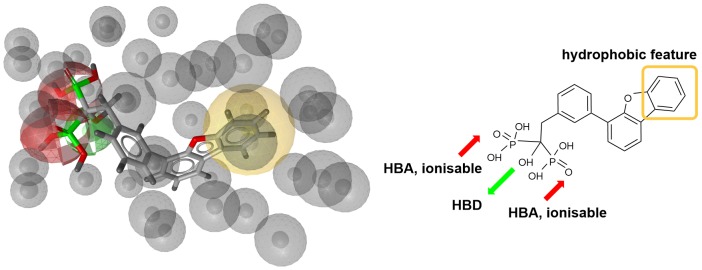
FIGURE 3.
Left: 3D representation of a pharmacophore model based on inhibitor BPH-629 (green spheres represent H-bond donating feature (HBD), red spheres represent H-bond acceptor feature (HBA) while yellow-colored sphere represents a lipohilic feature. Gray colored spheres are exclusion cones based on crystal structure PDB ID: 2E98); right is a 2D projection of BPH-629 inhibitor with explicitly defined pharmacophoric features.

