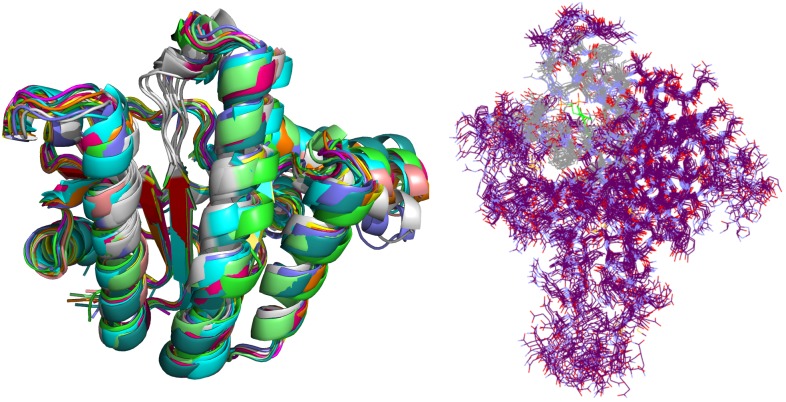
FIGURE 4.
Selected snapshots of E. coli UppS obtained with MD and ClusCo clustering. Individual chains are presented in ribbon model colored distinctly for every snapshot used in the ensemble docking experiment. In this manner, movement of the protein along the MD trajectory is emphasized and observed (left). Defined binding site for GOLD ensemble docking experiment in gray-colored line model representation; in green colored line representation there is the center residue of the defined binding site for docking experiment while the rest of the protein is depicted as purple colored line model (right).

