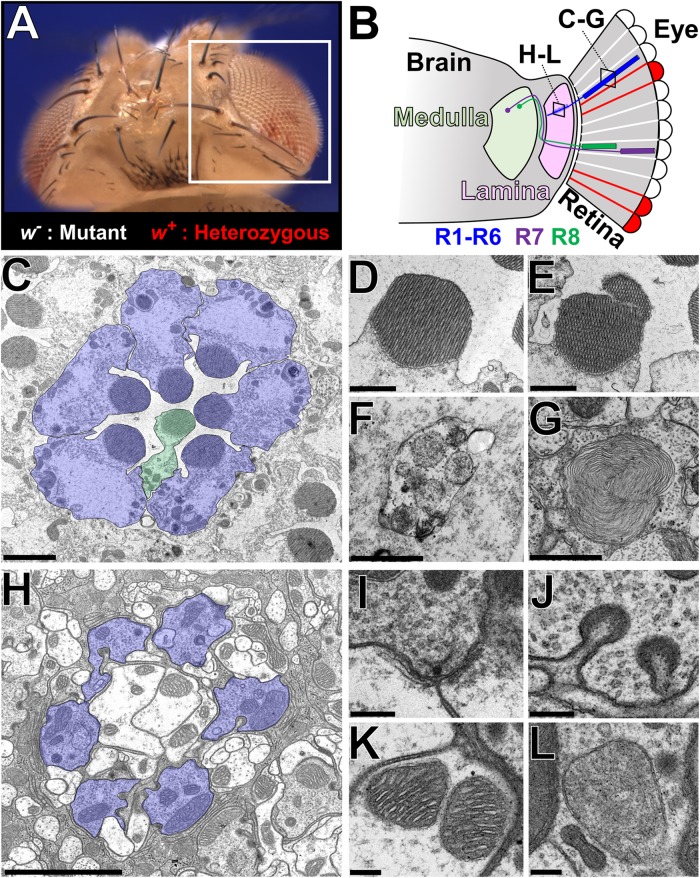
FIGURE 2.
Ultrastructural analysis of the Drosophila visual system to assess neurodegenerative phenotypes in X-screen mutant clones. (A) Image of an adult Drosophila head that is mosaic for a mutation of interest (y w mut∗ FRT19A/cl(1) FRT19A; ey-FLP/+). The white box indicates the region depicted in B. (B) Simplified diagram of the Drosophila visual system. The retina is composed of ∼700 ommatidia, each containing eight photoreceptors that are surrounded by a layer of pigment cells that function as glia. Photoreceptors R1–R6 target their axons to the lamina, whereas R7 and R8 connects to the medulla. The two boxes indicate the location of TEM sections shown in C–G and H–L, respectively. (C) TEM image of a cross section through a single ommatidia. R1–R6 is highlighted in blue, and a R7 or R8 cell (stacked on top of one another as in B) is highlighted in green. (D–G) Higher magnification images of some subcellular structures observed in the retina; (D) Healthy rhabdomere, (E) rhabdomere undergoing fragmentation, (F) autophagosome, (G) multilamellar body. (H) TEM image of a cross section through a single lamina cartridge. Axon terminals of R1–R6 cells (highlighted in blue) synapse onto dendrites of large monopolar cells neurons and amacrine cells in the lamina. Each cartridge is separated by three epithelial glial cells. (I–L) Higher magnification images of some subcellular structures observed in the lamina; (I) synaptic active zone marked by a T-bar, (J) capitate projections, (K) mitochondria with normal cristae structure, and (L) abnormal mitochondria that lack fine cristae structure. Scale bars = 2 mm (C,H), 1 mm (D–G), and 200 nm (I–L). TEM images were kindly provided by Lita Duraine (Howard Hughes Medical Institute, Baylor College of Medicine).

