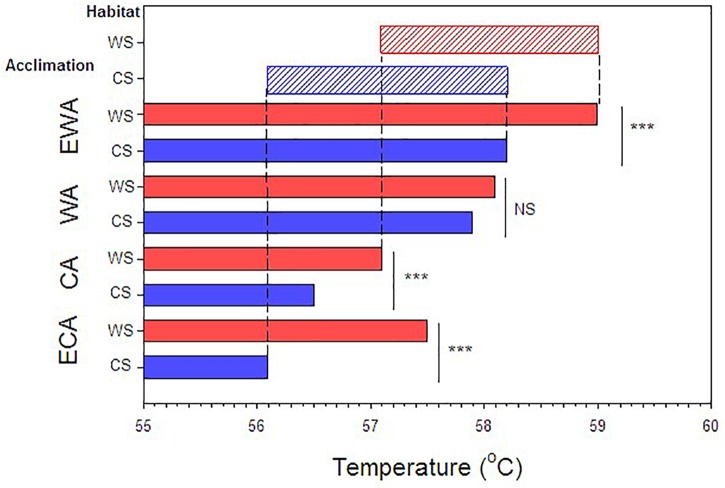
FIGURE 4.
Compilation of results showing the LT50 values for the various acclimation and acclimatization (habitat) conditions. Red bars indicate warm shore acclimatization (WS) and blue bars, cool shore acclimatization (CS). ECA, CA, WA, EWA refer to extra-cool, cool, warm and extra-warm acclimation, respectively. Asterisk indicates P < 0.01 and NS, non-significant difference. Lightly shaded upper bars indicate acclimation capacities and ranges for warm shore (red) and cool shore (blue) acclimatized snails.

