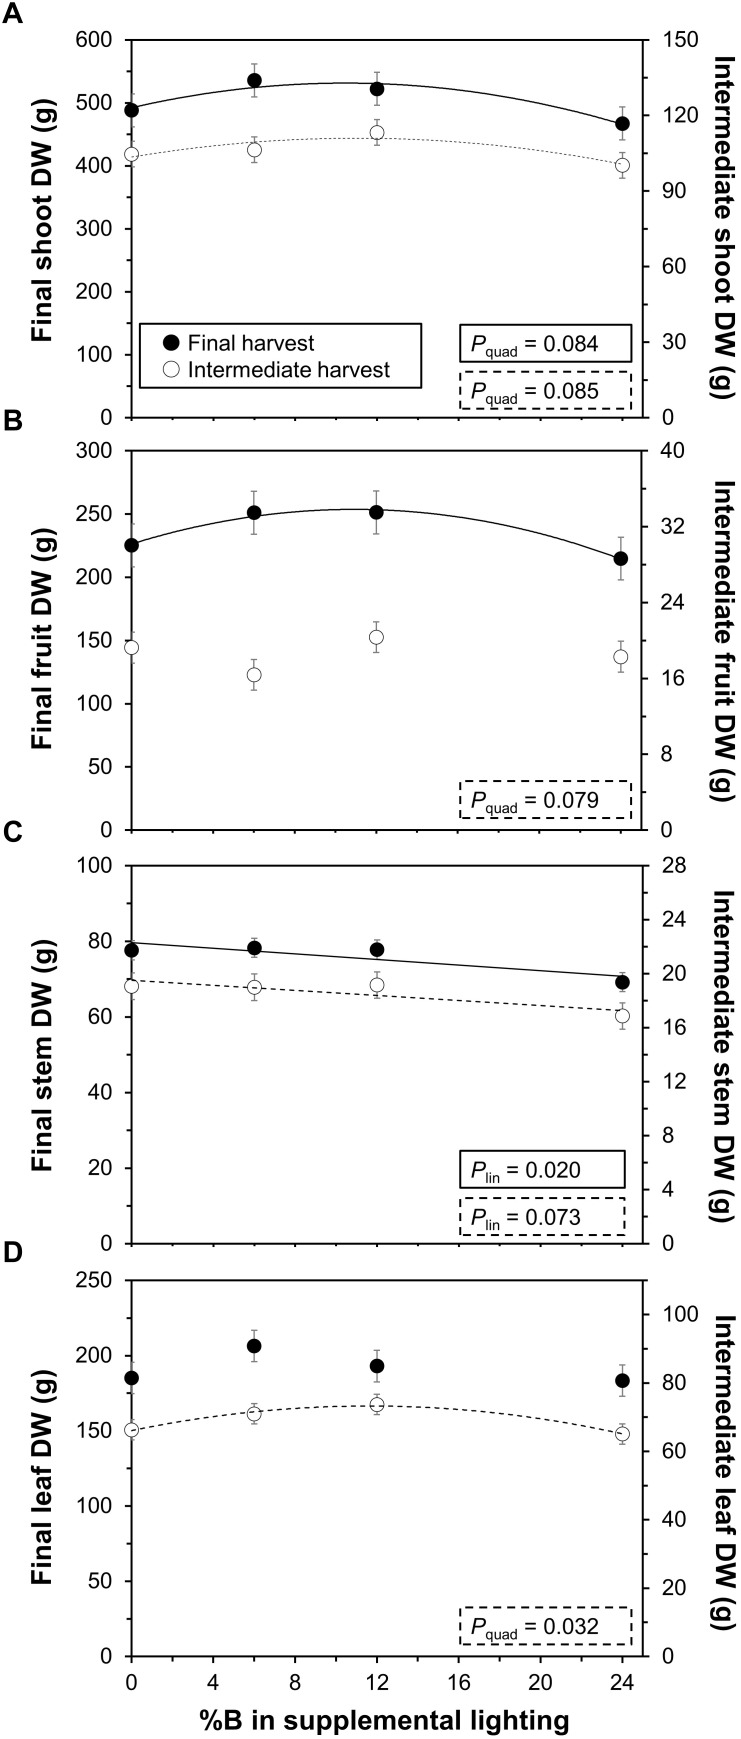
FIGURE 3.
Effects of percentage of blue light in supplemental lighting on biomass per plant. (A) total shoot dry weight (DW); (B) fruit DW; (C) stem DW; and (D) leaf DW. Final harvest occurred 111 DOT, intermediate harvest 40 DOT. Data include periodically picked ripe fruits and old leaves. For significant quadratic or linear effects of supplemental blue light, a trendline together with the respective P-value is depicted. Data gathered from three plants per plot were averaged for one value per plot. The treatment average ± SEM was then calculated based on values from two plots per treatment (n = 2).

