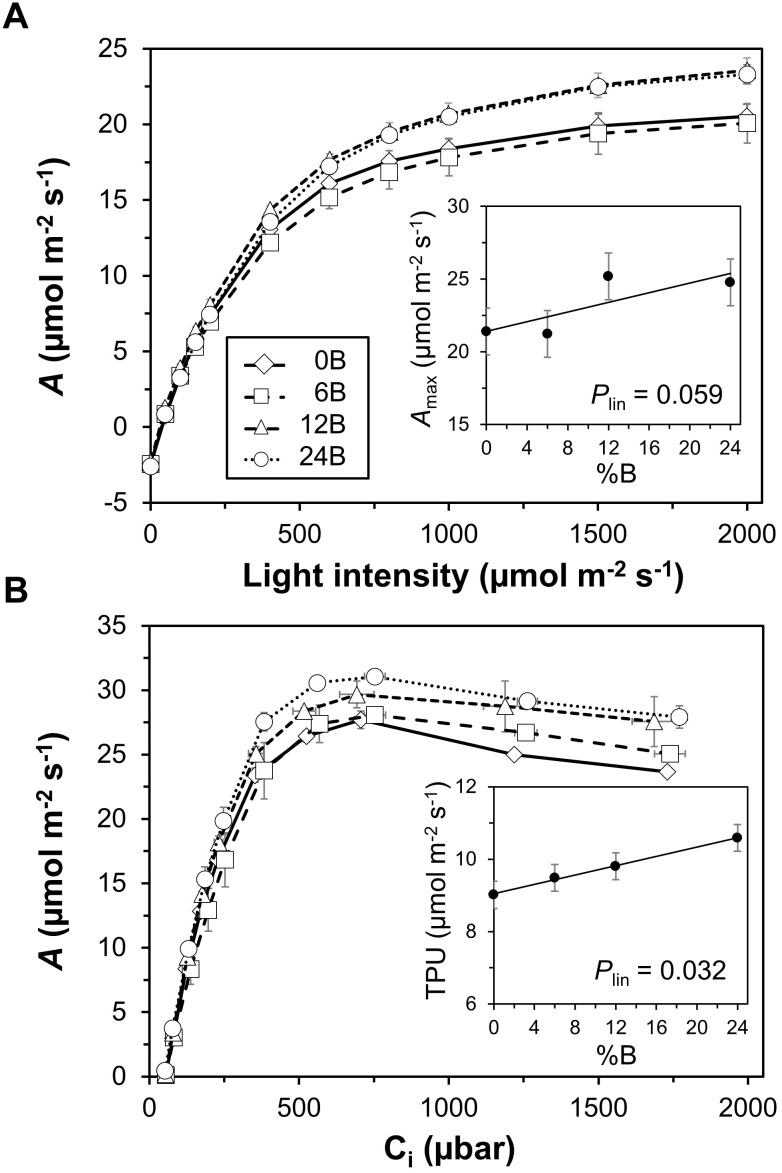
FIGURE 5.
Response curves of net photosynthesis rate (A) to light intensity (A) and leaf internal CO2 partial pressure (Ci; B). Insets: (A), relationship between light-saturated net photosynthesis rate (Amax) and percentage of blue light used in supplemental lighting (%B); (B) relationship between maximum rate of triose phosphate utilization (TPU) and %B. Trendlines together with P-values depict significant linear effects of %B on Amax and TPU. Data were recorded 25–27 DOT. Data gathered from three plants per plot were averaged for one value per plot. The treatment average ± SEM was then calculated based on values from two plots per treatment (n = 2).

