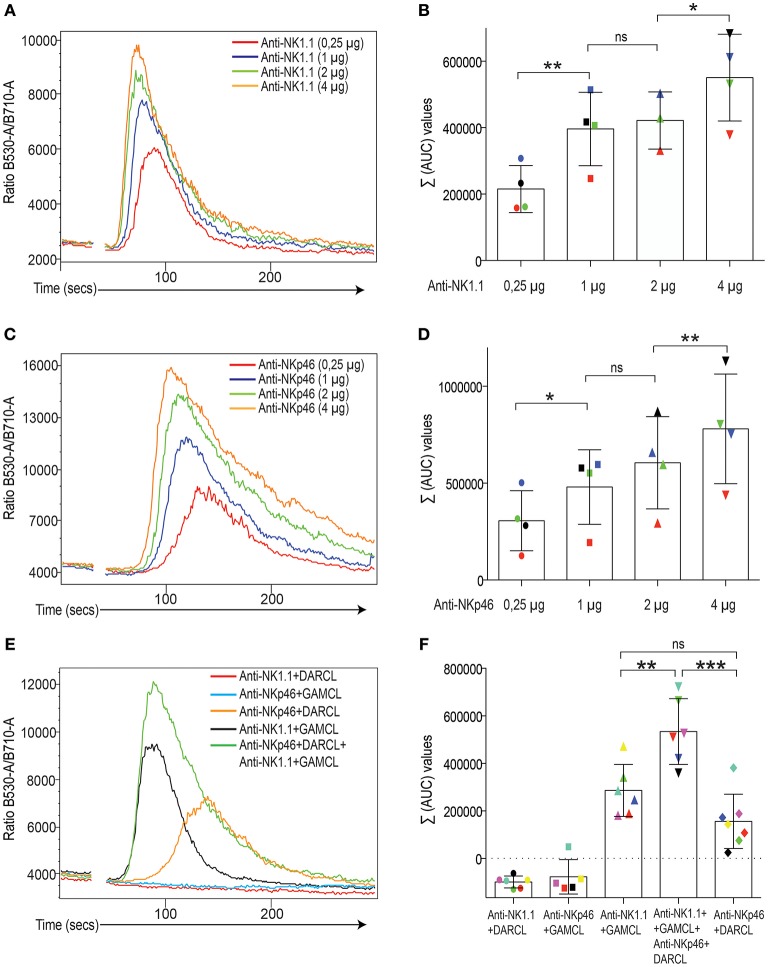
Figure 1.
. Induction of Ca2+ flux in mouse NK cells after crosslinking of activating receptors. (A) Calcium flux response (kinetics plot of the ratio between Fluo-4 and Fura-red) after NK1.1 crosslinking. The colored lines depict various concentrations of the primary antibody.One representative experiment. (B) Total area-under-the-curve (AUC) values after baseline correction (see Materials and Methods) from four independent experiments. Different colors indicate different experiments. Statistics calculated using a one-way paired Student's T-test. (C) Same setup as in A but with an antibody against NKp46. (D) Same setup as in (B) but for NKp46 antibody. (E) Calciums flux response (kinetics plot of the between Flou-4 and Fura-red) after individual and simultaneous crosslinking of NK1.1 and NKp46 on isolated NK cells. Different crosslinkers were used for NK11 and NKp46 primary antibodies. DARLC, donkey-anti-rat (used for NKp46) and GAMCL, goat-anti-mouse (used for NK1.1). One representative experiment. Note lack of cross-reactivity beteen the crosslinkers (flat lines). (F) Total AUC values after baseline correction (see Material and Methods) from 5 to 7 independent experiments, which are color-coded. Some experiments did not inluce all groups. Note additive Ca2+ flux response when two receptors were crosslinked simultaneously. Statistical analysis was performed using a one-way ANOVA with Tukey's multiple comparisons test. *p < 0.05, **p < 0.01, ***p < 0.001, ns, not significant.

