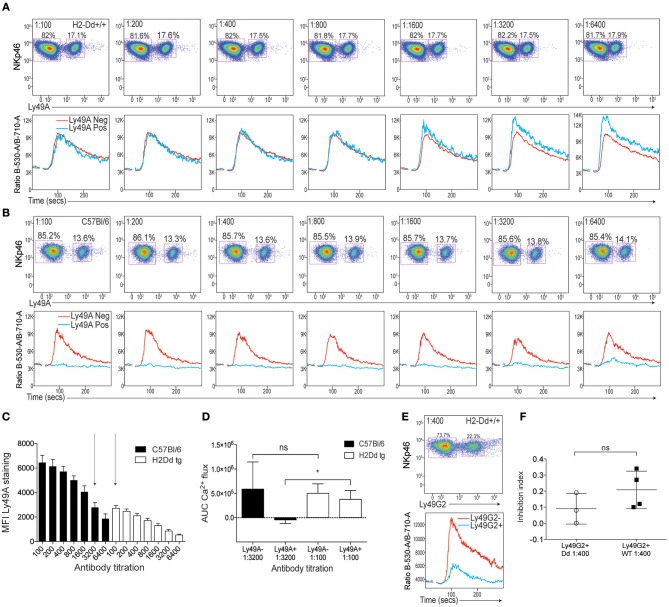
Figure 3.
Poor effect of Ly49A receptor crosslinking on NK1.1-induced Ca2+ flux in NK cells from mice expressing the Ly49A ligand H2Dd. (A) Top: Staining of Ly49A on NKp46+ NK cells from H2Dd mice at various dilutions of anti-Ly49A antibodies. Bottom: Kinetics plot of the Fluo-4/Fura-red flourescence ratios in NK cells from H2Dd mice stained with various concentrations of anti-Ly49A together with a fixed concentration of anti-NK1.1. The blue line represents the response of the NK cell subset expressing Ly49A and the red line represents Ly49A-negative NK cells in the same sample. (B) Same setup as in A but on NK cells from B6 mice. (C) Mean fluorescence intensity (MFI) of Ly49A staining at various dilutions of anti-Ly49A on NK cells derived from B6 (black bars) or H2Dd (white bars) mice. Three independent experiments are pooled. Arrows indicate antibody titrations at which the MFI of Ly49A staining was similar between B6 and H2Dd mice. (D) AUC values of Ca2+ flux in Ly49A-positive and Ly49A-negative NK cells from B6 and H2Dd mice at the anti-Ly49A concentrations indicated by arrows in (C) (1:100 for H2Dd and 1:3,200 for B6). Statistical analysis performed using one-way ANOVA with Tukey's multiple comparisons test. (E) Top: Staining of Ly49G2 on NKp46+ cells from H2Dd mice. Bottom: Kinetics plot of the Fluo-4/Fura-red flourescence ratios in Ly49G2-positive (blue) and Ly49G2-negative (red) NK cells from H2Dd mice stained with anti-Ly49G2 at 1:400 dilution. (F) Inhibition index comparison between the degree of Ly49G2-mediated inhibition in H2Dd mice and B6 mice. Based on 3–4 independent and comparable experiments. Statistics was calculated using a paired Student's T-test. *p < 0.05, ns , not significant.

