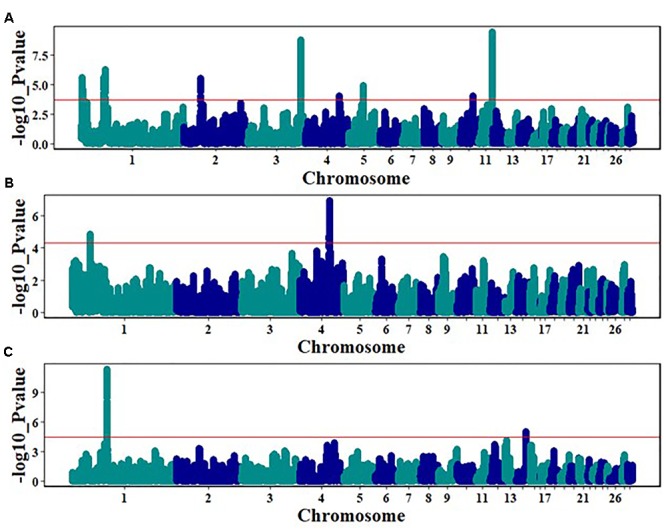
FIGURE 5.

HapFLK analysis over the entire genome across breeds/ecotypes in three country populations: red line indicates the upper 0.05% of hapFLK distribution, for (A) within Egyptian breeds/ecotype, (B) within Sri Lanka ecotypes, and (C) with Cochinchina and Brahma Brazil breeds.
