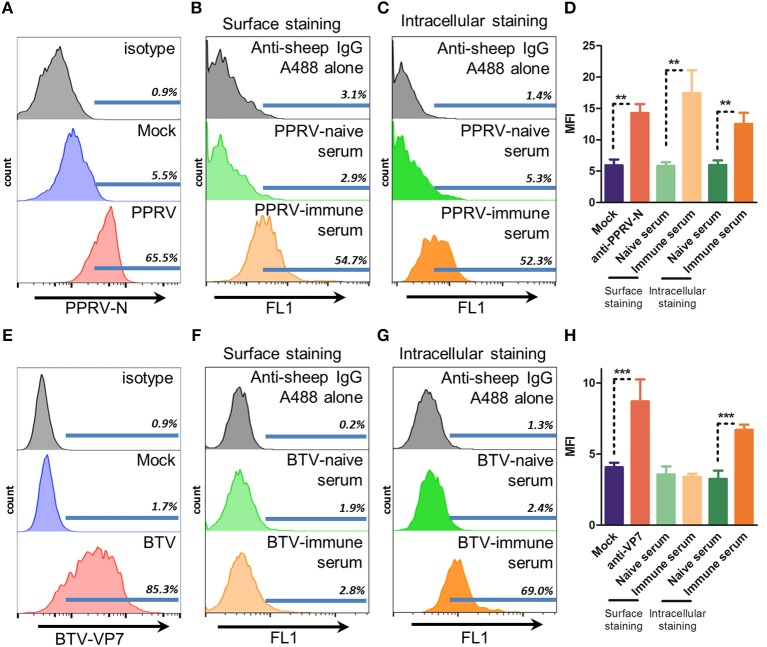
Figure 1.
Immune sera from PPRV but not BTV bind to infected cells. (A–D) Representative flow cytometry histograms (n = 3) of B cell enriched ovine PBMC mock-infected or infected with PPRV IC'89 at MOI 3 for 48 h and stained with (A) anti-PPRV-N antibody, (B) surface stained, or (C) stained intracellularly with PPRV-naïve or -immune serum or, as control, secondary antibody alone (anti-sheep IgG). (D) Mean fluorescence intensity (MFI) of PPRV IC'89-infected B cell enriched ovine PBMC stained with anti-PPRV-N antibody, PPRV-naïve or –immune sera. Mean ± SD MFI for 3 naive and immune sera are represented. **p < 0.01 One-way ANOVA with Bonferroni's post-test. (E–H) Representative flow cytometry histograms of STC cells (n = 2–4) mock-infected or infected with BTV-8 at MOI 3 for 24 h and (E) stained with anti-BTV-VP7 antibody; (F) surface stained with BTV-naïve or -immune serum or, as control, secondary antibody alone (anti-sheep IgG); or (G) stained intracellularly with BTV-naïve or immune serum or, as control, secondary antibody alone (anti-sheep IgG). (H) Mean fluorescence intensity (MFI) of BTV-8 infected STC cells, stained with anti-BTV-VP7 antibody, BTV-naïve or -immune sera. Mean ± SD MFI for 2 to 4 naive and immune sera are represented. ***p < 0.001 One-way ANOVA with Bonferroni's post-test.

