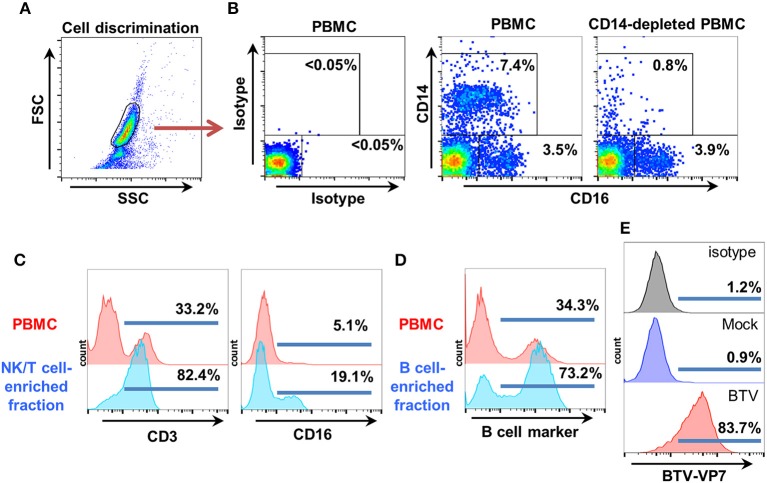
Figure 2.
Target and effector cell isolation for ovine ADCC assays. (A) Ovine PBMC were obtained by standard gradient centrifugation separation. CD14+ cells were depleted using anti-CD14 microbeads as described by the manufacturer. Cell discrimination was established using FSC/SSC dot-plots. (B) Representative flow cytometry dot-plots (n = 4) for CD14 and CD16 staining in PBMC and in CD14-depleted PBMC are shown. Isotype controls were used to establish CD14/CD16 gatings. (C) The effector fraction used in ADCC assays was obtained after elution of CD14-depleted PBMC from nylon wool columns. This fraction is enriched in NK and T cells. Representative flow cytometry histograms (n = 6) after CD3 and CD16 staining in PBMC and in the NK/T cell enriched eluate are shown. (D) The autologous target cell fraction used in ADCC assays was obtained after flushing the cells trapped in the nylon wool column. This fraction is enriched in B cells. Representative flow cytometry histograms (n = 6) for B cell marker expression in PBMC and B cell enriched eluate are shown. (E) The B cell-enriched fraction was mock-infected or infected with BTV-8 (MOI 3). Target cell infection with BTV-8 was monitored by flow cytometry using anti-BTV-VP7 staining.

