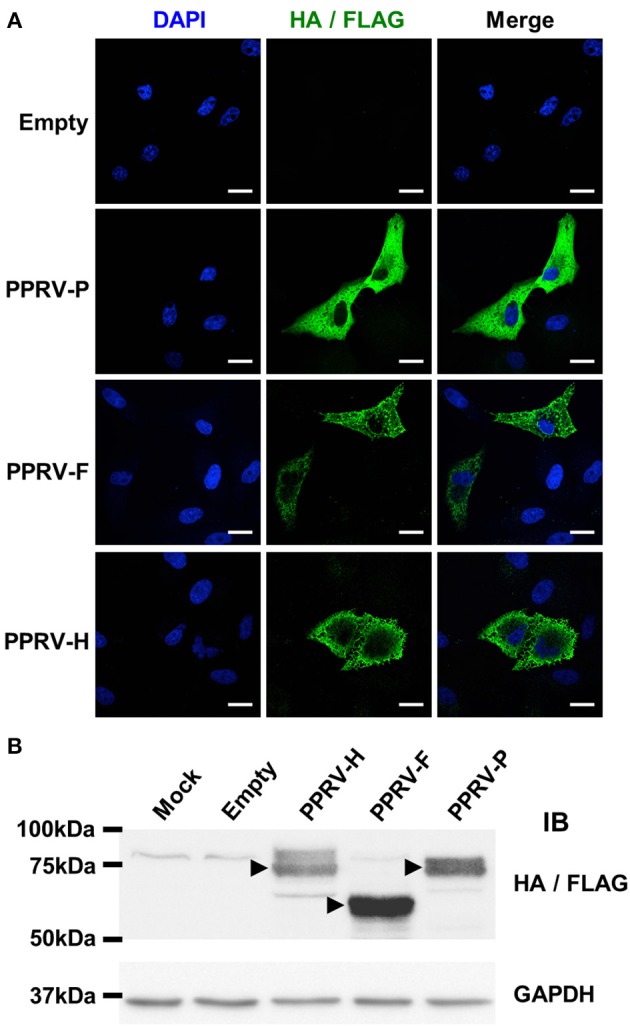
Figure 4.

PPRV-P, -F, and -H expression in transfected cells. (A) Vero cells were grown on coverslips, transfected with pCAGG-Empty, -PPRV-F-HA, -PPRV-H-HA, or pIRES-PPRV-P-FLAG, and protein expression assessed using anti-tag antibodies (HA/FLAG). Nucleic acids were visualized by DAPI staining. Representative confocal images of transfected cells are shown. Scale bar = 20 μm. (B) 293T cells were mock-transfected (Mock) or transfected with pCAGG-Empty, -PPRV-F-HA, -PPRV-H-HA or pIRES-PPRV-P-FLAG, and cell lysate obtained. Proteins were resolved on 10% SDS-PAGE, transferred to nitrocellulose membrane and probed (IB) for protein expression using anti-tag antibodies (HA/FLAG). Membranes were also probed with anti-GAPDH antibody as loading control. Arrowheads indicate protein bands at the predicted molecular weight for PPRV-H (70 kDa), PPRV-F (59 KDa), and PPRV-P (75–79 kDa depending on phosphorylation).
