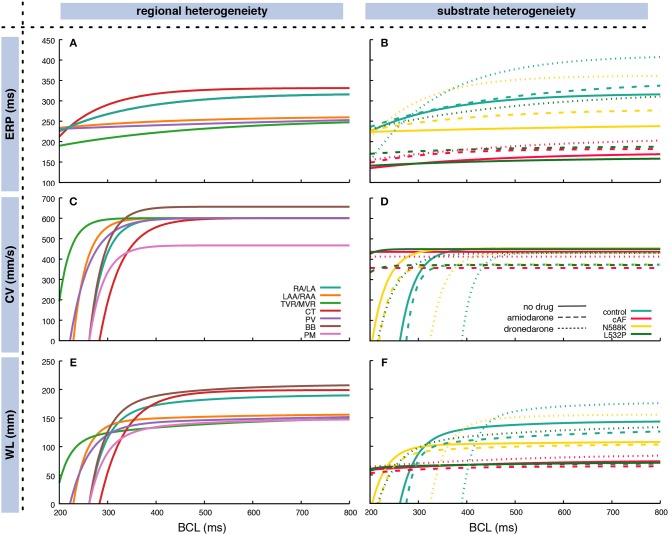
Figure 3.
Fitted exponential restitution curves of ERP (A,B) and CV (C,D), as well as the WL as the product of the former measures (E,F) for different anatomical regions in the atria (A,C,E) and different substrates (B,D,F). In (B,D,F), the dashed lines represent the respective substrates under the influence of 2.3 μM amiodarone whereas the dotted lines represent the influence of 0.21 μM dronedarone. Exponential curves according to Equation (3) were used to fit the output of monodomain tissue strand simulations. The CV for the homgeneous control model in (D) was reduced compared to the RA/LA tissue in the heterogeneous setup in (C) to obtain a similar total atrial activation time. In (A), BB and PM curves are covered by the RA/LA curve. Coefficients are listed in Supplementary Table 1. RA, right atrium; LA, left atrium; CT, crista terminalis; PM, pectinate muscles; BB, Bachmann's bundle; II, inferior isthmus; PV, pulmonary veins; RAA, right atrial appendage; LAA, left atrial appendage; TVR, tricuspid valve ring; MVR, mitral valve ring.

