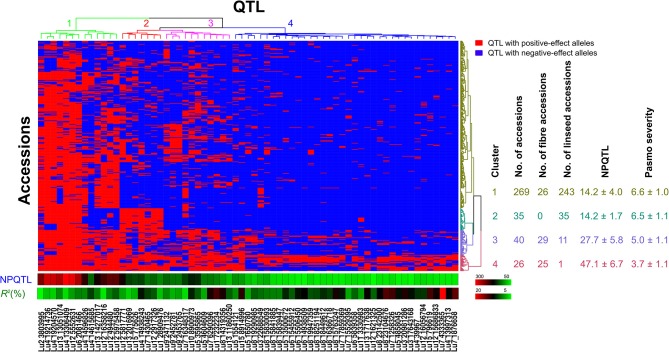
Figure 6.
Cluster analysis of the association panel based on a set of 67 stable large-effect QTL. The accessions were grouped into four clusters and the QTL were assigned to four sub-groups. Tag QTNs of QTL were chosen for analysis. QTL with positive-effect alleles (PQTL) in the accessions are indicated in red; blue indicates the absence of PQTL. NPQTL, the number of QTL with positive-effect alleles.

