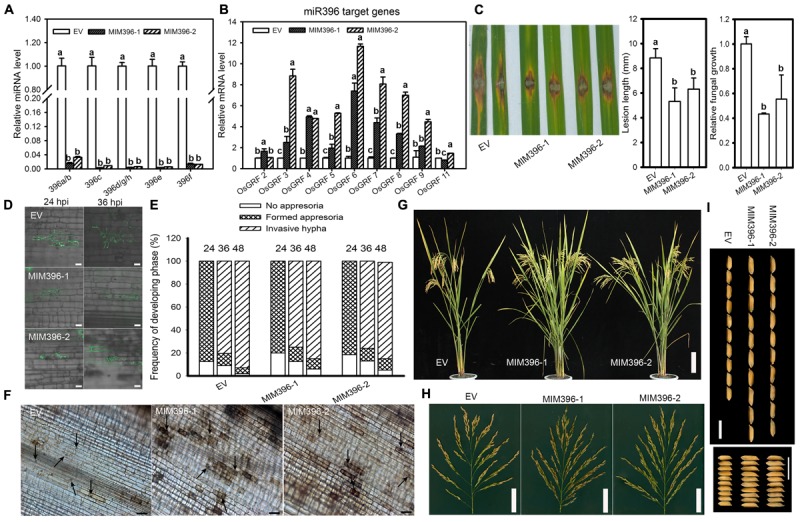
FIGURE 5.

Overexpression of miR396 target mimicry results in enhanced resistance to M. oryzae with improved yield traits. RT-qPCR analyses show the expression of miR396 isoforms (A) and its target genes (B) in control plants (EV, empty vector in YB background) and transgenic lines over-expressing target mimicry of miR396. The accumulation level was normalized to that of the control plants. (C) Punch inoculation of 4–5 week old leaves from EV (YB), MIM396-1 and MIM396-2 rice plants show disease severity of M. oryzae (Zhong1, 1 × 10⁵ spore/ml conc.) at 5 day post inoculation. Relative fungal biomass is determined by examining the expression level of M. oryzae Pot2 gene against OsUbiquitin DNA level. (D) Representative confocal images of sheath cells from EV, MIM396-1 and MIM396-2 infected by eGFP-tagged blast isolate GZ8. Bars = 20 μm. (E) Quantification analysis on the progress of fungal infection at 24, 36, and 48 hpi. Around 200 conidia in each line were analyzed. Similar results were obtained in at least two independent experiments. (F) DAB staining shows H2O2 accumulation at the infection sites of the indicated lines at 2 days post inoculation (dpi). Arrows indicate appressoria. Bars = 100 μm. (G–I) Comparison of gross plant (G), scale bar = 14 cm; and panicle morphologies (H), scale bar = 5 cm; and seed length and seed width (I), scale bar = 10 mm, of EV (YB) and miR396 mimic (MIM396-1 and MIM396-2) plants. In (A–C), error bars indicate SD from three technical replicates. The letters above the bars indicate significant differences at a P-value < 0.01, as determined by a one-way ANOVA followed by post hoc Tukey HSD analysis.
