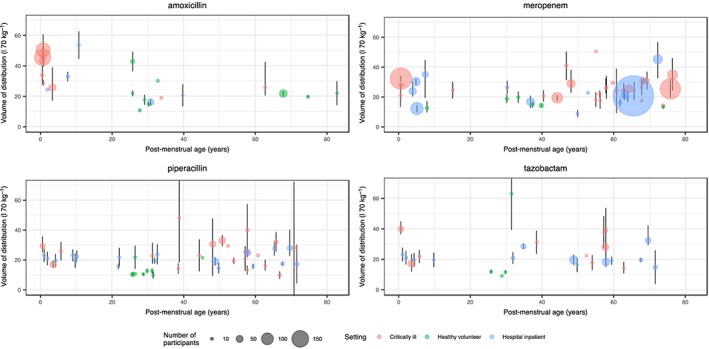
Figure 3.

Weight‐standardized volume of distribution values identified from the literature search, plotted against age. Mean volume values (standardized to a 70‐kg individual) from each study are plotted with an associated confidence interval (where available). The size of the points is proportional to the number of participants. Colours are used to denote the setting of the study. There appears to be greater uncertainty in parameter estimates of studies in critically ill compared with healthy populations. Weight‐based allometric scaling appears to control for the effects of age, except for amoxicillin, where there appears to be a greater volume of distribution for neonates compared with adults
