
Figure 5.
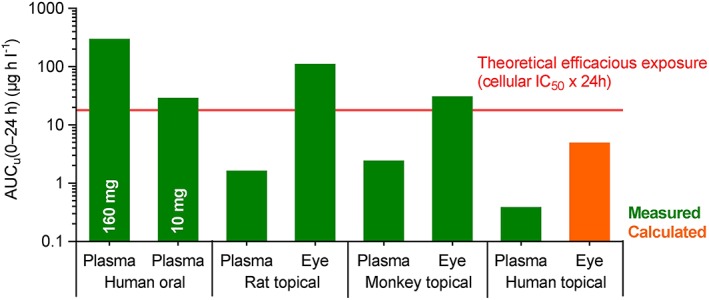
Model showing plasma and eye exposure of regorafenib based on routes used in animal and human studies. AUCu (0–24 h), area under unbound concentration curve from time 0 to 24 h. Data from rat studies published in 19, data from primate studies partly published in 18. Remaining data on file. Data on systemic exposure taken from the study report of the study referenced in [25]. IC50 , half‐maximal inhibitory concentration