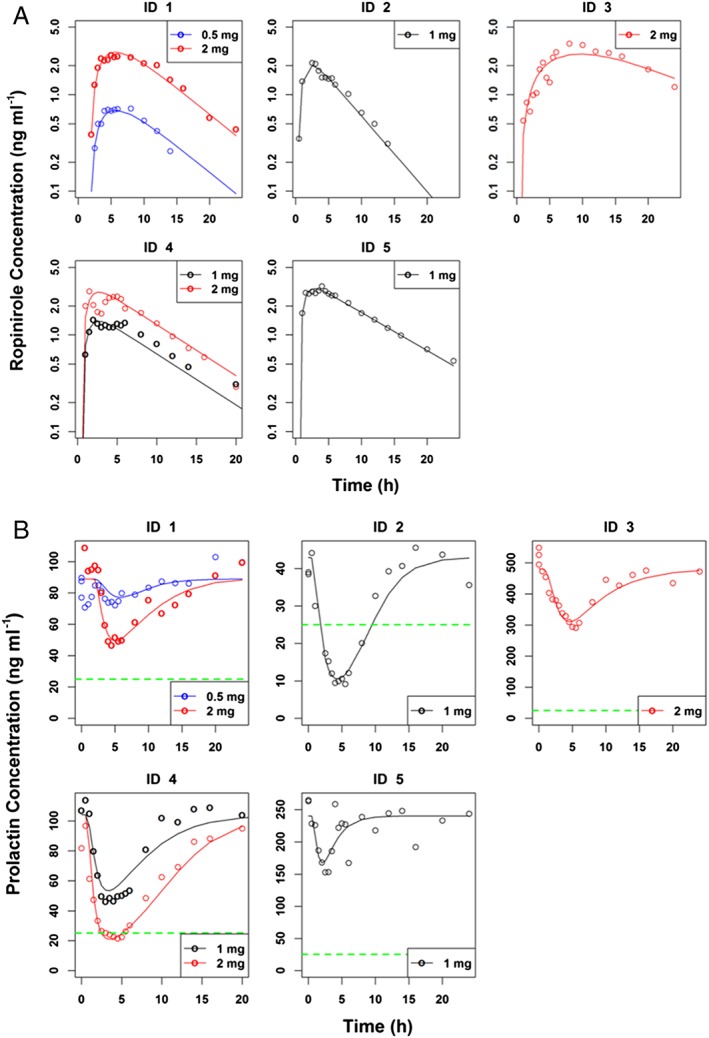
Figure 1.

(A) Individual plasma ropinirole concentration versus time profiles after the oral administration of single doses of ropinirole (0.5, 1.0 and 2.0 mg) in five hyperprolactinaemic patients. Symbols represent observations from individual patients and lines are individual predictions. (B) Time profiles of prolactin concentrations after oral administration of ropinirole at the indicated doses to hyperprolactinaemic patients. Solid lines indicate individual model predictions and empty circles are observed prolactin concentrations. Green dashed lines indicate the upper limit of normal for prolactin which is 25 ng ml–1
