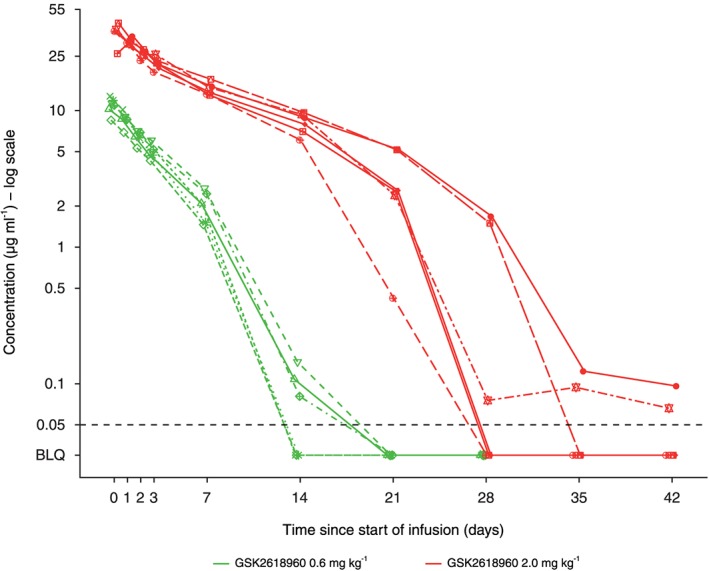
Figure 2.

GSK2618960 plasma concentrations in individual subjects following a single intravenous infusion. Symbols represent individual subjects. The dashed horizontal line represents the lower limit of quantification (LLQ = 50 ng ml–1). BLQ, below the limit of quantification
