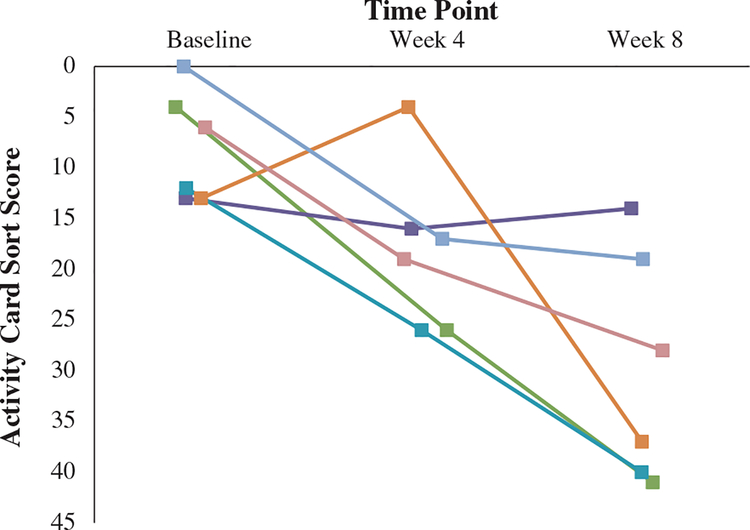
Figure 2.
Participant scores (n = 6) on the Activity Card Sort depicting the number of times that each participant engaged in their top five goal activities at baseline, week 4, and week 8. Downward-sloping lines correspond to higher levels of participation in activities (i.e. lower levels of avoidance).

