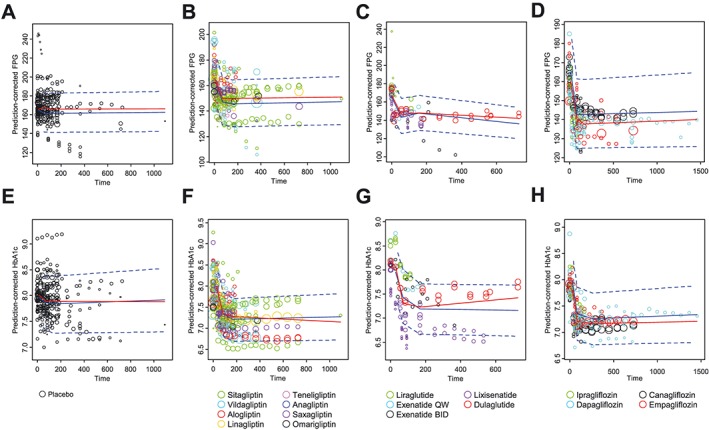
Figure 2.

Prediction‐corrected visual predictive check plots for fasting plasma glucose (FPG) of the placebo (A), dipeptidyl peptidase‐4 inhibitors (DPP‐4i) (B), glucagon‐like peptide‐1 receptor agonists (GLP‐1r) (C), and sodium glucose cotransporter 2 inhibitors (SGLT2i) (D) as well as haemoglobin A1c (HbA1c) of the placebo (E), DPP‐4i (F), GLP‐1r (G) and SGLT2i (H). Red solid lines represent the observed median. Blue solid and dashed lines represent the predicted median and 80% prediction intervals, respectively. Open circles represent observed data, and the symbol size is proportional to the number of subjects in each study
QW, once weekly; BID, twice daily
