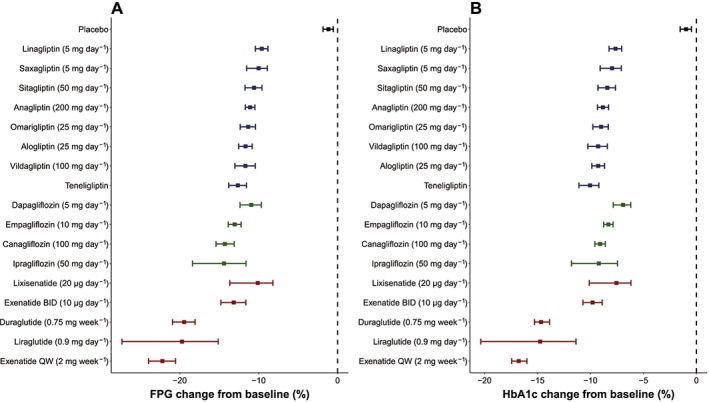
Figure 3.

Reductions in FPG (A) and HbA1c (B) 90 days after the initiation of add‐on therapy. Each square and bar represent the median and 90% confidence interval from model simulation (n = 1000) for each drug. Red, green, and blue squares and bars represent changes from the baseline in FPG for GLP‐1r, SGLT2 and DPP‐4, respectively. The dosage was set to the recommended dose of each drug in Japan
QW, once weekly; BID, twice daily
