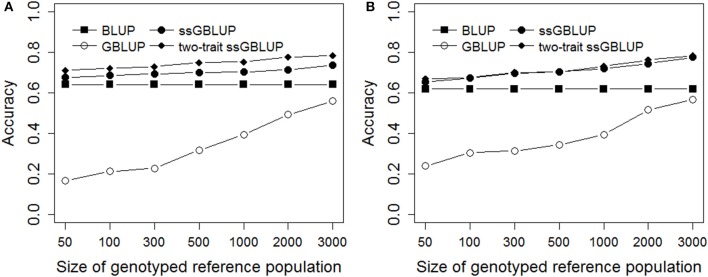
Figure 2.
Accuracies with different genotyped reference population sizes on simulated data. The figure indicates the accuracy was improved with increasing the genotyped reference population size. However, the increase was small when the genotyped reference population size was <500 for single-step methods. The heritabilities of Trait A (A) and Trait B (B) were 0.1 and 0.3.

