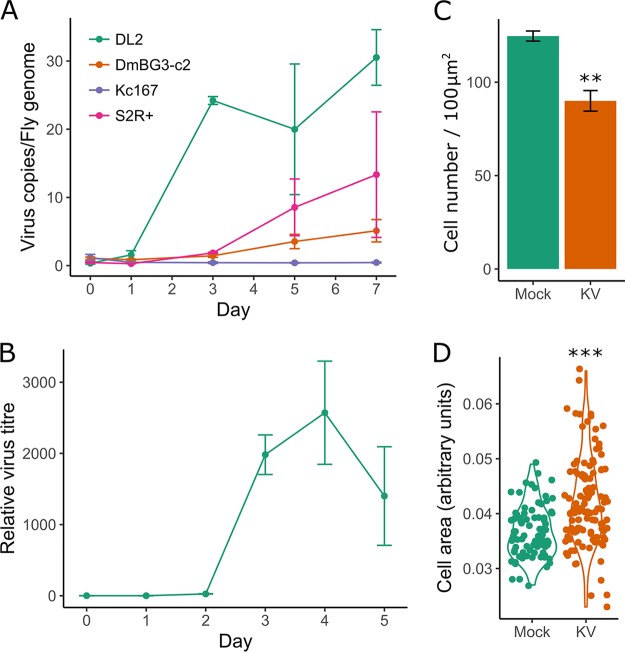
FIG 2.
(A) KV replicates in cell culture. KV growth was assessed in various D. melanogaster cell lines by qPCR against the KV genome, relative to the fly gene Rpl32 (n = 3 for each time point). (B) KV release from S2 cells into the culture medium was assessed by DNA extraction of 50 μl of culture medium and qPCR against the KV genome, plotted relative to the amount of KV in the medium directly following infection (i.e., zero time point is equal to 1). (C) Cell density (number of cells per approximately 100 μm2 in KV versus mock-treated cells) at 10 dpi (n = 3). (D) Size of mock- or KV-infected cells at 10 dpi. Each dot represents a single cell, and the data distribution is presented as a violin plot. Error bars show SEMs.

