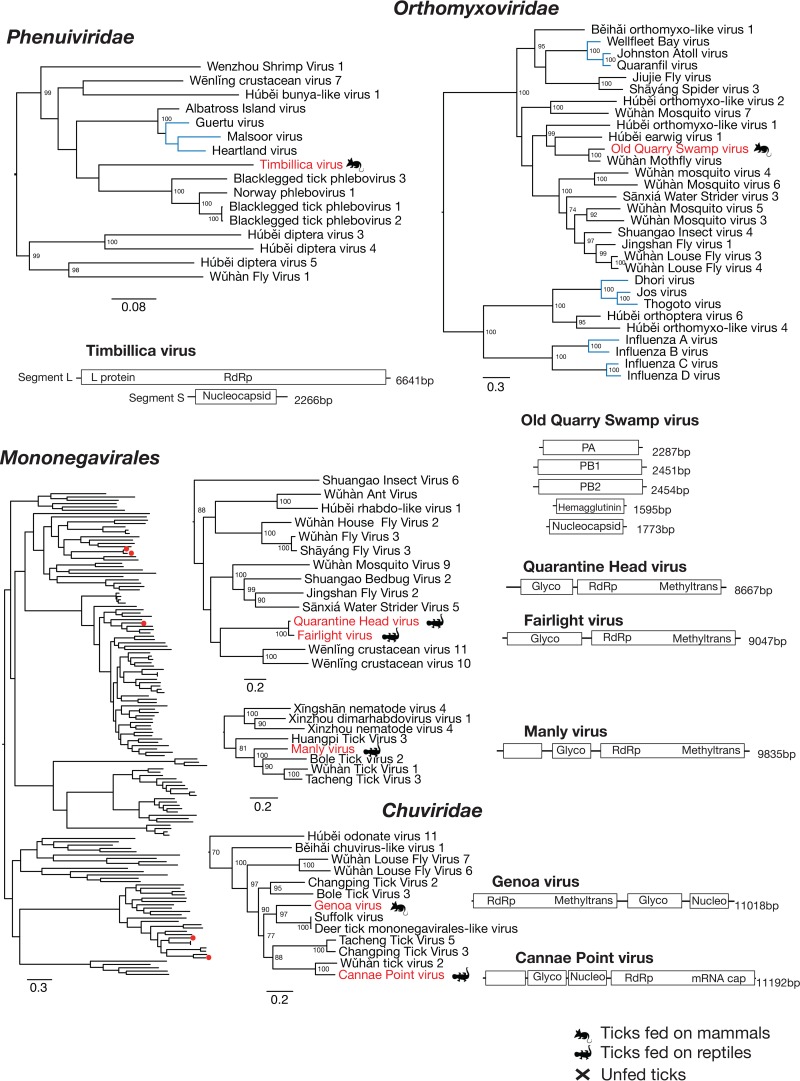
FIG 6.
Phylogenetic relationships and genomic structure of the −ssRNA viruses sampled in this study. All trees are scaled according to the number of amino acid substitutions per site. The trees are midpoint rooted for clarity, and bootstrap values (>70%) are shown. Viruses determined here are shown in red. The symbols denote the vertebrate host that the tick was taken from or whether the virus was sampled from an unfed tick. Virus lineages previously shown to infect mammals or mammalian cells are shown in blue. Genome diagrams provide information on the length of each genomic segment, the number of predicted ORFs, and predicted conserved protein structures.

