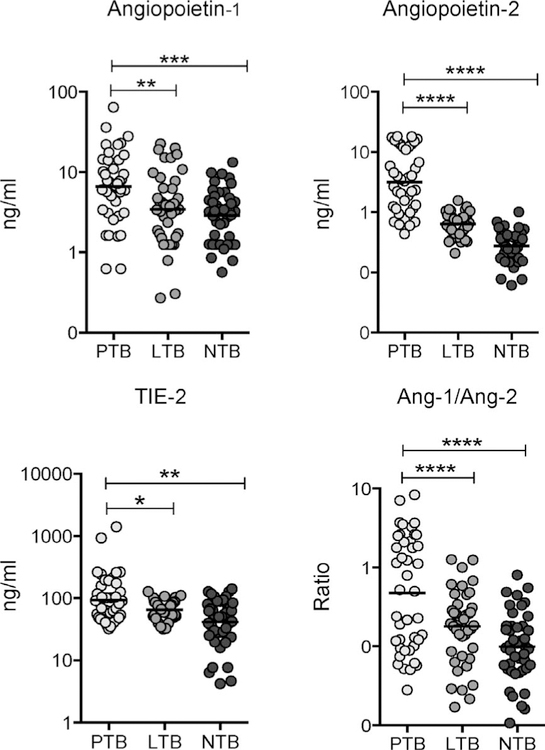
Figure 1.
Elevated systemic levels of circulating angiopoietins in individuals with PTB. Plasma angiopoietins (Ang-1 and 2) and Tie-2 levels, as well as the Ang-1/Ang-2 ratio, were measured in individuals with PTB (n = 44), LTBI (n = 44) and NTBI (n = 44). Data are represented as scatter plots: each circle represents a single individual, horizontal bars indicate the geometric mean P values calculated using the Kruskal-Wallis test with Dunn’s post hoc comparison. PTB = pulmonary tuberculosis; LTB = latent tuberculous infection; NTB = no tuberculous infection.

