Figure 2.
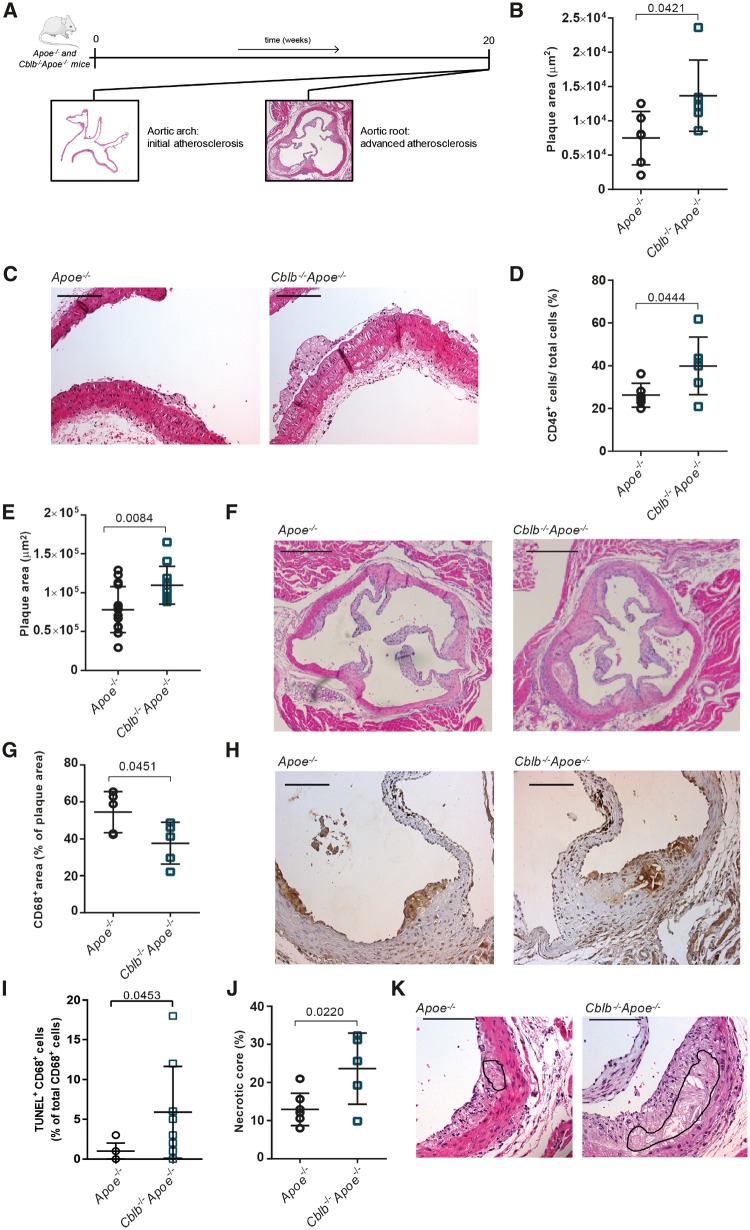
Casitas B-cell lymphoma-B deficiency aggravates atherosclerosis in Apoe−/− mice. (A) Atherosclerosis was analysed in the aortic arch, where initial plaques were present, and the aortic root, which contained advanced atherosclerotic plaques. (B) Atherosclerotic plaque area in the aortic arch of 20-week-old Apoe−/− (n = 6) and Cblb−/−Apoe−/− (n = 6) mice. (C) Representative longitudinal sections of aortic arches in Apoe−/− and Cblb−/−Apoe−/− mice (the brachiocephalic trunk is shown; haematoxylin and eosin staining). Scale bar: 50 μm. (D) Immunohistochemical quantification of the relative number of CD45+ cells per plaque (n = 6 per genotype). (E) Aortic roots of 20-week-old Apoe−/− (n = 15) and Cblb−/−Apoe−/− (n = 11) mice were used to analyse the amount of atherosclerosis. (F) Representative pictures of haematoxylin and eosin-stained aortic root cross-sections containing advanced atherosclerotic plaques in Apoe−/− and Cblb−/−Apoe−/− mice. Scale bar: 500 μm. (G, H) Plaque macrophage content and representative images of CD68 staining. Scale bar: 200 μm. (I) Percentage of apoptotic (TUNEL+CD68+) macrophages in the plaques. (J, K) Quantification of necrotic core area in plaques of aortic roots. Representative pictures are shown. The black line indicates the necrotic core. Scale bar: 100 μm. Data are presented as mean ± standard deviation.

