
Figure 5. Ca2+-dependent affinities of CaM for binding to CaMBD1a, 1b, 2, and 3.
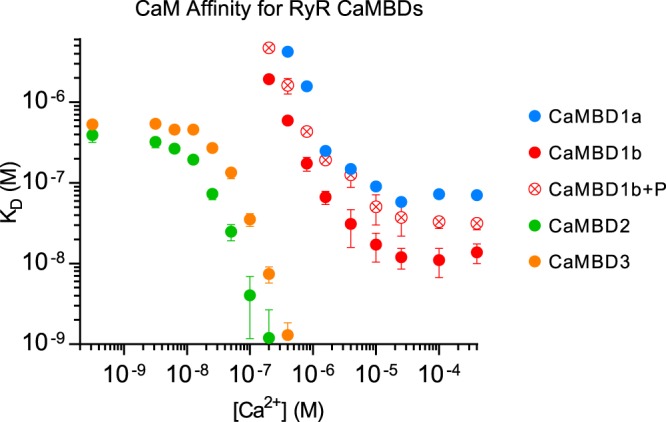
The binding model-fitted affinities (KD) are plotted as a function of [Ca2+]. CaMBD color codings correspond to those indicated in Figure 2. Note the double logarithmic axes. Error bars represent the 95% confidence intervals of two (CaMBD1a and -1b ± P) or three (CaMBD2 and -3) replicates.