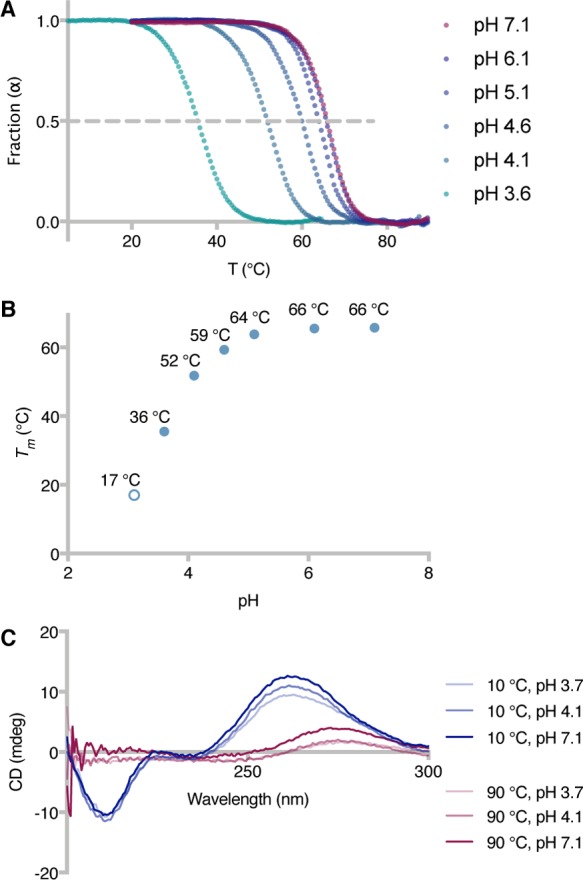
Figure 1.

Modulation of RNA melting temperature by pH variations. (A) UV thermal melting curves of duplex 1 at different pH values (100 mM Na+, 10 mM citrate buffer, pH 3.6–7.1). Fraction of duplex RNA (α)32 vs temperature (T): α = 1 for double-stranded RNA, and α = 0 for single-stranded RNA. (B) Plot of duplex 1Tm vs solution pH, as determined from panel A. The Tm at pH 3.1 was calculated from the first-derivative maximum of the thermal melting curves (see the Supporting Information). (C) Circular dichroism spectra of duplex 1 at different pH and temperature values.
