Fig. 2.
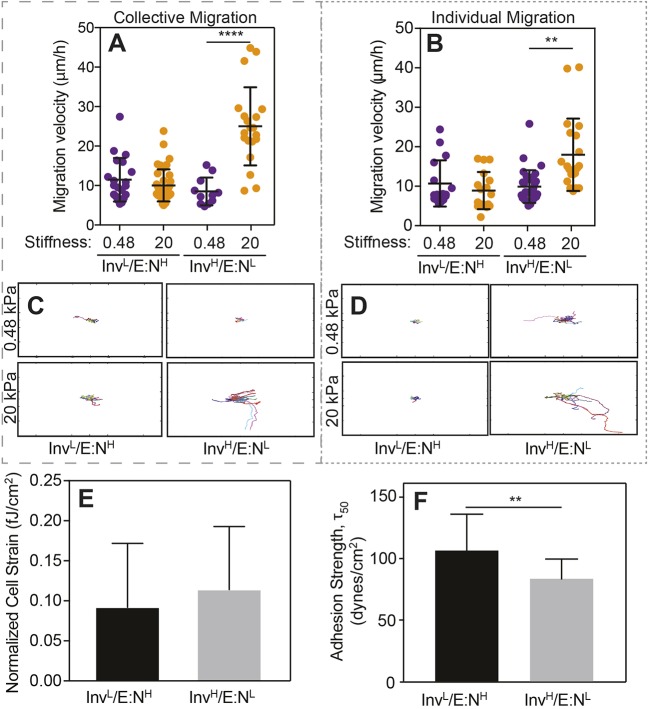
InvL/E:NH cell migration is stiffness insensitive. (A,B) Collective (A) and individual (B) cell migration for the indicated cell lines on soft (purple) and stiff (orange) substrates. Each point represents the average velocity of an individual cell. For panel A, n=20, 40, 20 and 20 cells for the groups from triplicate experiments. For panel B, n=16, 17, 31, and 20 cells for the groups from triplicate experiments. **P<0.01 and ****P<0.0001 for Welch's t-test comparisons of velocities as a function of stiffness for each cell line. (C,D) Rose plots of collective (C) and individual (D) cell migration pathways for the indicated cell lines on soft (top) and stiff (bottom) substrates over a 24 h period. n=4 for each plot. Plot size is 1 mm2. (E) Average cell strain normalized to cell area for the indicated cell line. n=42 (InvL/E:NH) or 17 (InvH/E:NL) cells from triplicate experiments. fJ, femtojoules. (F) Average adhesion strength for the indicated cell lines exposed to shear stress that caused 50% of the population to detach, i.e. τ50. n=9 for both groups. **P<0.01 for Welch's t-test.

