
Fig. 4.
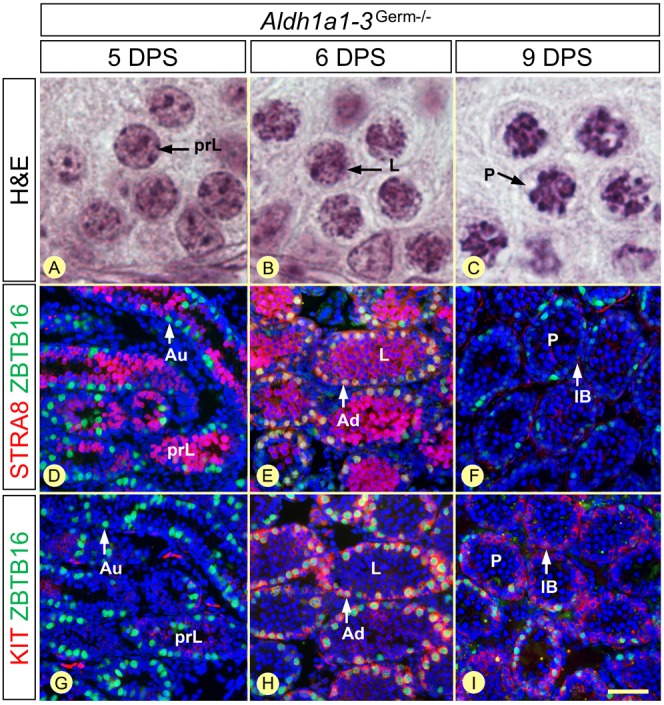
Chronology of GC differentiation in Aldh1a1-3Germ−/− testes 5, 6 and 9 days after synchronization. (A-C) Morphology of the spermatocytes, present at the center of the seminiferous tubules, assessed by Hematoxylin and Eosin staining. (D-I) Characterization of the spermatogonia populations, present at the periphery of the seminiferous tubules, by detection of ZBTB16 (green signal) and either STRA8 or KIT (red signals), as indicated. Nuclei were counterstained with DAPI (blue signal). D and G, and E and H are adjacent sections. Au, Ad and IB indicate Aundiff, Adiff and intermediate or B spermatogonia, respectively; DPS, day post-synchronization; prL, L and P indicate preleptotene, leptotene and pachytene spermatocytes, respectively. Scale bar: 6 µm in A-C; 60 µm in D-I.