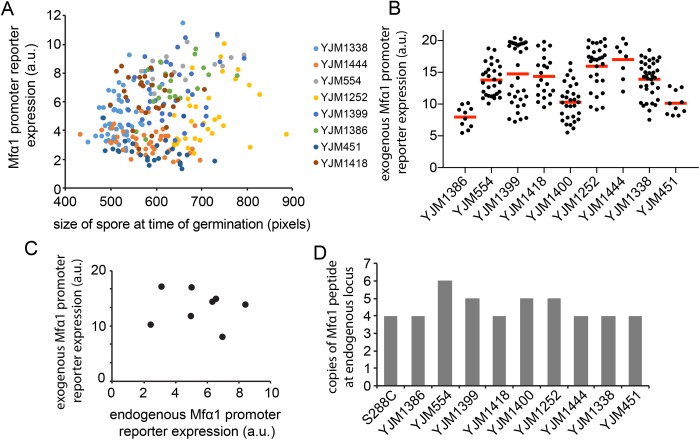
FIGURE 5:
Basis for differences in pheromone production between strains. (A) Relation between spore size and Mfα1 reporter expression in germinating spores. Each dot is one cell, color-coded by strain. (B) Mfα1 reporter driven by an exogenous lab strain Mfα1 promoter shows variable expression in different strains. (C) Relation between average endogenous Mfα1 reporter expression and average exogenous Mfα1 reporter expression. (D) Copy number of Mfα1 peptides at the endogenous locus of the different wild strains (Strope et al., 2015).

