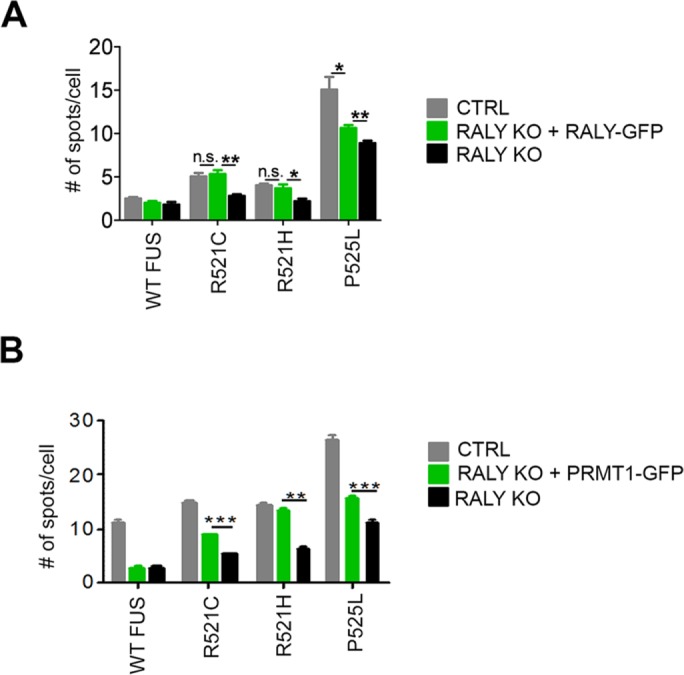
FIGURE 3:

RALY and PRMT1 overexpression partially retrieves FUS mutants’ aggregate formation. (A) The graph reports the quantification of FUS-HA number of spots per cell, obtained by high-content image analysis of control, RALY KO, and RALY KO + RALY-GFP HeLa cells. Bars indicate means ± SEM of five replicates, and p values were calculated with unpaired two-tailed Student’s t test to compare RALY KO + RALY-GFP to either control or RALY KO cells (*p < 0.05; **p < 0.01). n.s., not significant. (B) The graph reports the quantification of FUS-HA number of spots per cell, obtained by high-content image analysis of control, RALY KO, and RALY KO + PRMT1-GFP HeLa cells. Bars indicate means ± SEM of five replicates, and p values were calculated with unpaired two-tailed Student’s t test to compare RALY KO + PRMT1-GFP to either control or RALY KO cells (**p < 0.01; ***p < 0.001). n.s., not significant.
