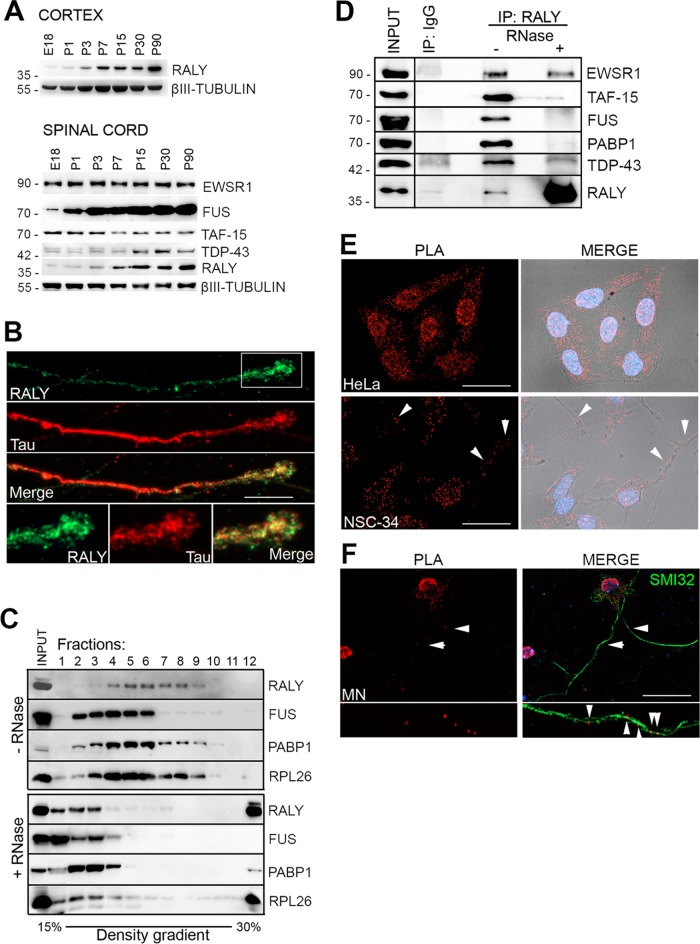
FIGURE 4:
FUS and RALY display similar expression profiles and are components of the same RNPs in MNs. (A) RALY expression increases with age in the mouse nervous system. Protein expression was analyzed by Western blot in mouse tissues at embryo-day 18 (E18) and postnatal days 1 (P1), P3, P7, P15, P30, and P90. In the cortex (top panel) RALY was analyzed; in the spinal cord (bottom panel) RALY, EWSR1, TAF-15, FUS, and TDP-43 were analyzed. As protein loading control, β-III TUBULIN was detected. (B) RALY localizes to MN axons and growth cones. Immunofluorescence assay displaying RALY in green and Tau in red. The scale bar corresponds to 10 μm. (C) Size fractionation of NSC-34 cell line RNA granules. Each fraction was processed for Western blot and probed with the indicated antibodies indicated. One-tenth of the cell extract was loaded in the first well as input control. Cell extract was either untreated (top panel) or RNase treated (bottom panel). RALY- and FUS-containing RNPs were enriched in fractions 4–9 (RALY) or fractions 2–6 (FUS), respectively. PABP1 bands indicate that the isolated RNPs were still intact. RPL26 serves as a marker to follow ribosomal fractionation. RNase treatment (bottom panel) shifted all proteins, including the RNP marker PABP1, toward lighter fractions on top of the gradient, meaning that RALY- and FUS-containing complexes were true RNA granules. (D) EWSR1, TAF-15, FUS, PABP1, and TDP-43 coimmunoprecipitate with RALY in an RNA-dependent manner. RALY was immunoprecipitated from either untreated or RNase-treated NSC-34 protein extracts. Normal rabbit IgG IP was performed as a control. Immunoprecipitated proteins were processed for Western blot and probed with the indicated antibodies. (E) RALY and FUS colocalize in nucleus and cytoplasm. PLA was performed in HeLa and NSC-34 cells to analyze RALY and FUS localization. Fluorescent signals identified colocalization spots in both nucleus (labeled by DAPI staining in blue) and cytoplasm (outlined by bright field acquisition). The scale bar corresponds to 40 μm. (F) RALY and FUS colocalize in MN axon. PLA was performed on MN primary cells and combined with SMI32 staining. Fluorescent signals identified colocalization spots in both nucleus, cell soma, and axon. The scale bar corresponds to 40 μm.

