FIGURE 7:
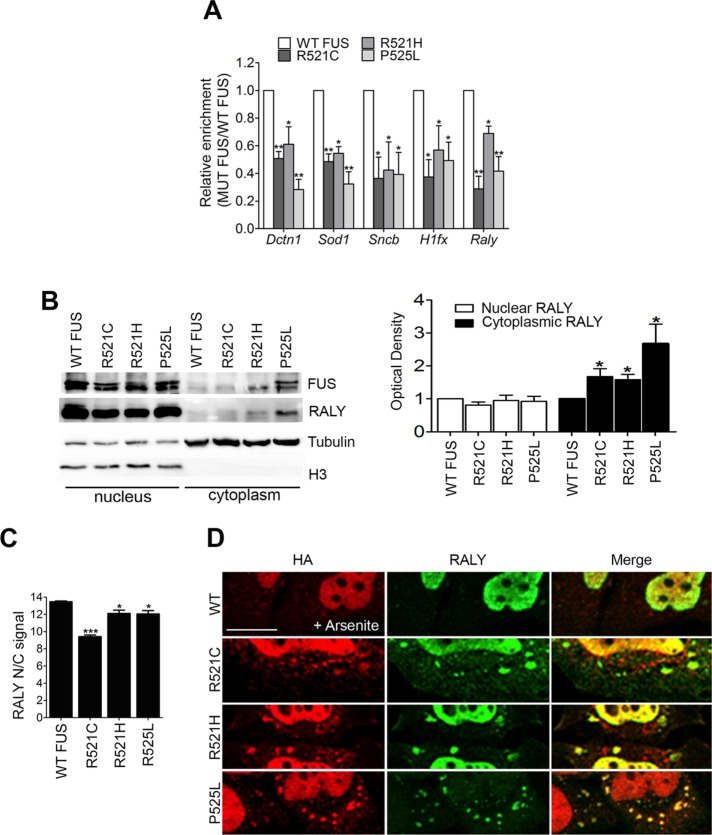
ALS-linked FUS mutants retain RALY in the cytoplasm, recruit it to cytosolic aggregates, and alter its interaction with mRNAs. (A) FUS mutants impair RALY interaction with Dctn1, Sod1, Sncb, Hifx, and Raly mRNAs. Doxycycline-induced NSC-34 cell extracts were processed for RIP analysis. The graph shows the statistical analysis of five independent experiments, normalized on Gapdh. To compare all the experiments, the yield was set equal to 1 for RALY RIPs in cells expressing WT FUS; hence the yield for RALY RIPs in cells expressing FUS mutants was calculated proportionately. Bars indicate means ± SEM of five replicates, and p values were calculated with unpaired two-tailed Student’s t test to compare FUS mutant with WT FUS expressing cells (*p < 0.05; **p < 0.01). (B) FUS mutants R521C, R521H, and P525L retain RALY in the cytoplasm. Doxycycline-induced NSC-34 cell extracts were processed for nucleus/cytoplasm separation and Western blot. On the right, the graph represents the mean of five independent experiments. Bars indicate means ± SEM, and p values were calculated with unpaired two-tailed Student’s t test to compare FUS mutant with WT FUS-overexpressing cells (*p < 0.05). (C) FUS mutants significantly retain RALY in the cytoplasm. The graph, obtained by high-content image analysis, reports the quantification of RALY nucleus/cytoplasm signal, in NSC-34 cells expressing WT or mutated FUS-HA, detected by immunostaining with anti-RALY and anti-HA antibody, respectively. Bars indicate means ± SEM of five replicates, and p values were calculated with unpaired two-tailed Student’s t test to compare FUS mutants with WT FUS-expressing cells (*p < 0.05; ***p < 0.001). (D) FUS mutants can recruit endogenous RALY to cytosolic aggregate triggered by arsenite treatment. Immunofluorescence images show FUS-HA staining (red) and endogenous RALY (green) in cytosolic aggregates. HeLa cells were transfected for 24 h before fixation. The scale bar corresponds to 10 μm.

