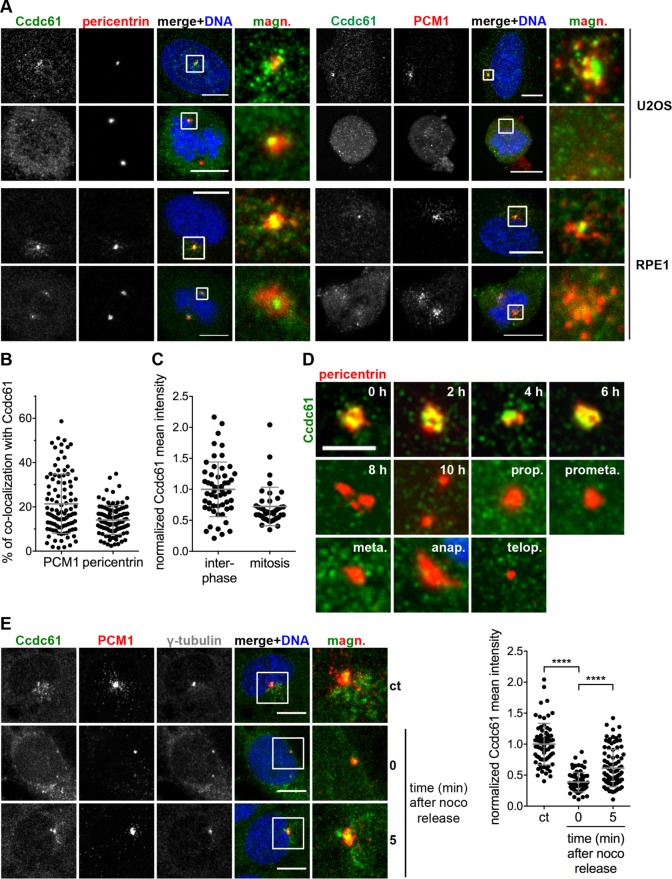
FIGURE 1:
Ccdc61 localizes MT-dependent at centrosomes and in their close proximity. (A) Costaining of endogenous Ccdc61 (green) with pericentrin or PCM1 (red) in U2OS and RPE1 cells. Chromatin is visualized by Hoechst33258 staining (blue). Magnified panels (magn.) show enlarged views of the boxed regions. Bar, 10 µm. (B) Graph shows the percentage of colocalization of endogenous Ccdc61 with either PCM1 or pericentrin in U2OS cells. Therefore, signals of PCM1 or pericentrin were used as a mask to measure the corresponding Ccdc61 signal intensity. n = 100 cells for each colocalization. Data represent mean value ± SD. (C) Endogenous Ccdc61 signal was quantified in a 3-µm2 circle around the centrosome in interphase or mitotic U2OS cells. Interphase Ccdc61 signal was normalized to 1.0. Interphase n = 54, mitosis = 40 centrosomes. Data represent mean value ± SD. (D) HeLa cells were released from a thymidine block and samples taken at indicated time points to localize endogenous Ccdc61 (green) at centrosomes by costaining pericentrin (red). Bar, 4 µm. (E) RPE1 cells were subjected to nocodazole (noco) to depolymerize MTs. After nocodazole washout, cells were fixed at the indicated time points and stained with antibodies directed against Ccdc61 (green), PCM1 (red), and γ-tubulin (gray). Magnified panels (magn.) show enlarged views of the boxed areas. Bar, 10 µm. Quantification shows normalized mean intensity of Ccdc61 in a 3-µm2 circle around the centrosome. The intensity was normalized to the nocodazole-untreated sample (ct: control). Data represent mean ± SD. from three independent experiments, n > 69 cells. ****p < 0.0001 (unpaired Student’s t test).

