FIGURE 6:
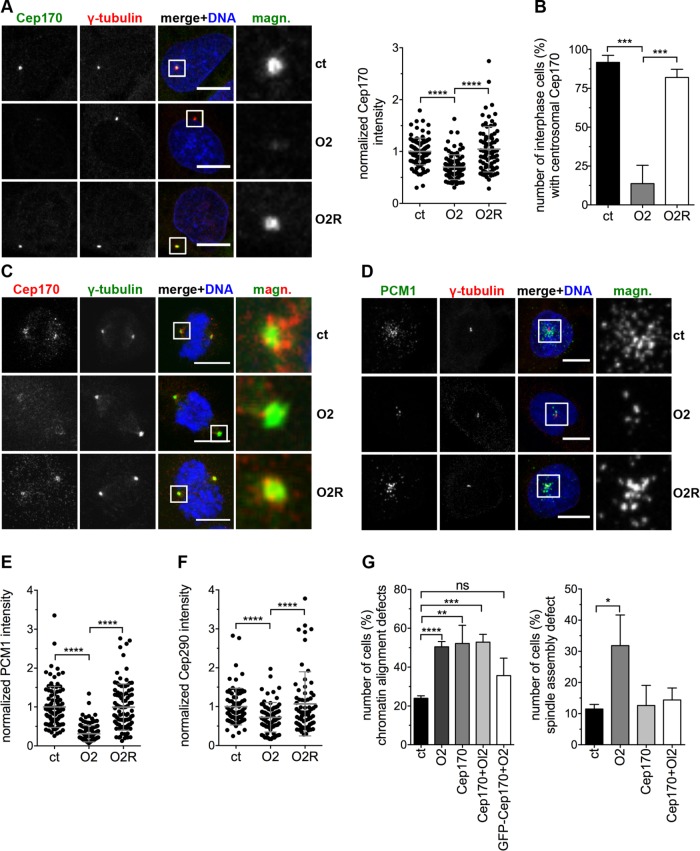
Ccdc61 regulates the centrosomal anchorage of the MT binding protein Cep170. (A) U2OS cells were transfected with the indicated siRNAs or siRNA/plasmid combinations and the localization of Cep170 analyzed. Representative images show staining with Cep170 (green) and γ-tubulin (red); DNA was costained with Hoechst33258 (blue). Scattered dot plot shows the Cep170 intensity quantified in a 25-µm2 circle around the centrosome normalized to the control (ct). Data represent mean ± SD from three independent experiments, n > 77 cells. ****p < 0.0001 (unpaired Student’s t test). (B) Centrosomal localization of Cep170 in interphase U2OS cells after indicated treatments was determined by visual inspection of 120–150 cells per treatment and experiment. Data represent mean ± SD from three independent experiments, ***p < 0.001 (unpaired Student’s t test). (C) Mitotic U2OS cells were transfected with the indicated siRNAs or siRNA/plasmid combinations. γ-tubulin was used to visualize mitotic centrosomes (green), Cep170 visualized in red, and DNA in blue (Hoechst33258). Magnified panels (magn.) show enlarged views of the boxed regions. Bar, 10 µm. (D, E) U2OS cells were transfected with the indicated siRNAs or siRNA/plasmid combinations and the PCM1 localization analyzed. IF images in D show staining with PCM1 (green) and γ-tubulin (red); costaining of the DNA with Hoechst33258 (blue). Bar, 10 µm. Scattered dot plot in E shows the PCM1 intensity quantified in a 25-µm2 circle around the centrosome normalized to the ct. Data represent mean ± SD from three independent experiments, n > 92 cells. ****p < 0.0001 (unpaired Student’s t test). (F) U2OS cells were transfected with the indicated siRNAs or siRNA/plasmid combinations and the Cep290 levels around the centrosome (25-µm2 circle) quantified. Control (ct)-treated cells were normalized to 1.0. Data represent mean ± SD from three independent experiments, n > 72 cells. ****p < 0.0001 (unpaired Student’s t test). Representative images are in Supplemental Figure S7B. (G) U2OS cells stably expressing tagged α-tubulin and H2B were imaged every 5 min for 15–19 h 72 h after transfection of ct, O2, Cep170 siRNAs, a combination of O2 and Cep170 siRNAs (Cep170 + O2) or a combination of GFP-Cep170 together O2 (GFP-Ccdc61 + O2). Quantification shows the analyzed spindle assembly defects and chromatin alignment defect. Spindle assembly defects include various problems of the cell to assembly a properly formed spindle (including, e.g., multipolar spindle but also bipolar spindles struggling to align DNA as indicated in Figure 2, A and B, for O2 treatment). Chromatin alignment defects include disturbed formation of a properly arranged metaphase plate, e.g. lagging chromosomes. Data represent mean ± SD from three independent experiments, n > 135 cells. ns: not significant; *p < 0.05, **p < 0.01, ***p < 0.001, ****p < 0.0001 (unpaired Student’s t test).

