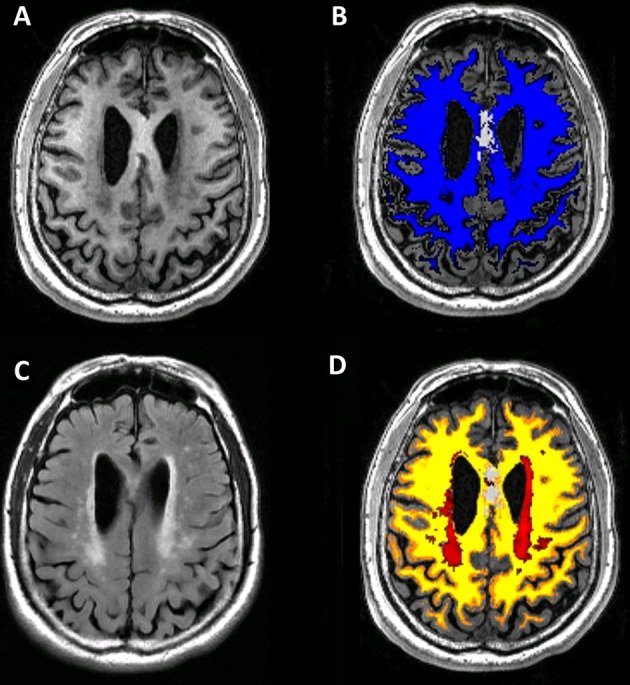
Figure 1.

Flowchart demonstrating our imaging process for each subject. The 3DT1 image (A) was segmented to white mater mapping (B) automatically on Statistical Parametric Mapping (SPM). Then the T2-FLAIR image (C) was co-registered to 3DT1 image. White matter hyperintensity (WMH) lesion segmentation was based on co-registered T2FLAIR image (C) on Lesion Segmentation Tool in SPM. Normal-appearing white mater mapping (D) was obtained by image subtraction of white mater mapping and WMH lesion.
