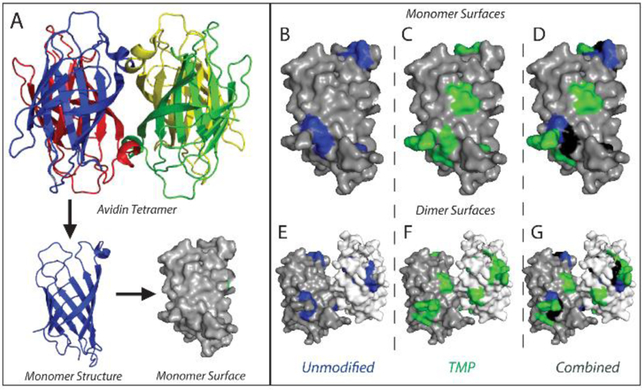
Figure 3.
Mapping locations of peptide bond cleavage on Avidin. (A) Depiction of the monomer surface map used for comparison of cleavage locations, generated from Avidin crystal structure (PDB code: 1AVD). Monomer and dimer surfaces from the complex were used for ease of view. (B-D) Cleavage site map of fragments from thirty-second accumulation for unmodified, TMP-modified, and both combined, respectively. (E-G) Cleavage site maps from (B-D) presented on dimer surfaces to highlight interface locations in the complete Avidin tetrameric complex. In the combined views (D, G), blue coloring indicates cleavage sites unique to unmodified Avidin, green coloring indicates those unique to TMP-modified Avidin, and black coloring indicates sites common to both.

