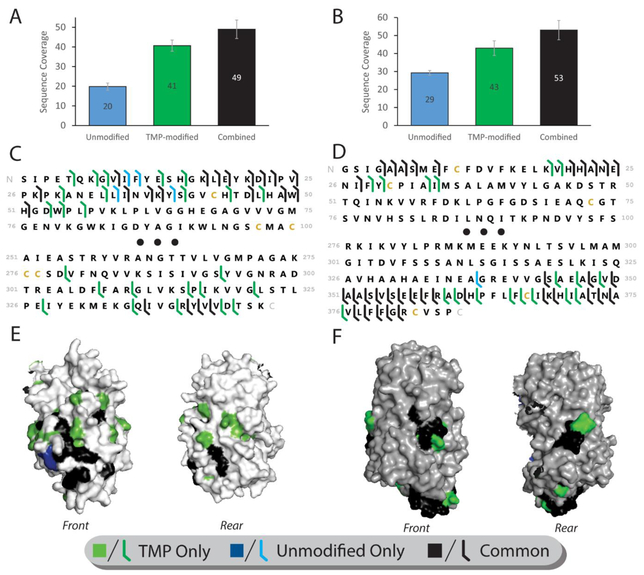
Figure 4.
Enhanced sequencing of large protein complexes ADH and Ovalbumin. (A, D) Total sequence coverage (number of unique peptide bond cleavage sites) obtained from modified and unmodified ADH (a) and Ovalbumin (d) (N=3). (B, E) Sequence map of cleavage sites obtained from ADH (B) and Ovalbumin (E). Black dots indicate the middle 150 (b) or 200 (e) residues of the protein sequence, from which no coverage was obtained for any condition. (C, F) Cleavage location maps for ADH (C) and Ovalbumin (F). As in figure 3, only a monomer is shown of the tetrameric structure to allow view of all sides. Coverage unique to unmodified protein is colored blue, TMP-modified protein is colored green, and sites common to both states are colored black

