Fig. 1.
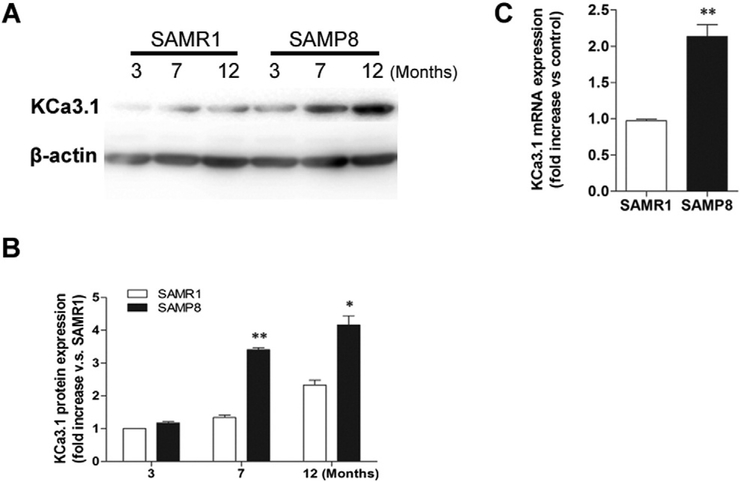
Up-regulation of KCa3.1 in the brains of SAMP8 mice. (A) Western blot analysis of KCa3.1 protein expression in the cortex of 3-, 7- and 12-month-old SAMR1 and SAMP8 mice. β-actin was used as the loading control. (B) The quantification of KCa3.1 protein expression in SAMR1 and SAMP8 mice (n = 3 each group). *p < 0.05, **p < 0.01, SAMP8 mice versus age-matched SAMR1 mice. (C) Quantitative real-time PCR analysis of KCa3.1 gene expression in 7-month-old SAMR1 and SAMP8 mice cortex. Values are shown for steady-state transcripts relative to β-actin in the same preparation. Results are expressed as mean ± SEM (n = 4). **p < 0.01, versus SAMR1 mice.

