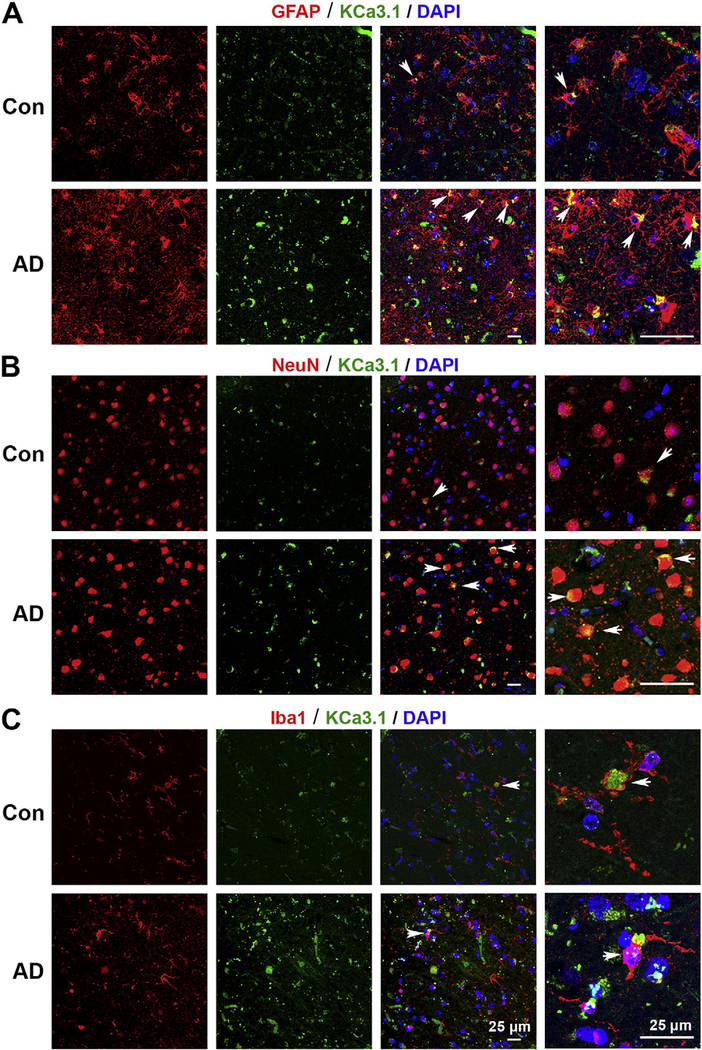
Fig. 3.
Up-regulation of KCa3.1 in reactive glial cells and neurons of Alzheimer’s patient brains. Double immunofluorescence staining of KCa3.1 (green) with GFAP (red), NeuN (red) or Iba1 (red) in brain sections of control and AD patients. (A) Co-staining of KCa3.1 and GFAP in control human and AD patients; (B) Co-staining of KCa3.1 and NeuN in control human and AD patients; (C) Co-staining of KCa3.1 and Iba1 in control human and AD patients. Arrows indicate co-labeling of KCa3.1 and GFAP (A), the co-labeling of KCa3.1 and NeuN (B) and the co-labeling of KCa3.1 and Iba1 (C). Nuclei were stained in blue with DAPI. Scale bar: 25 μm.

