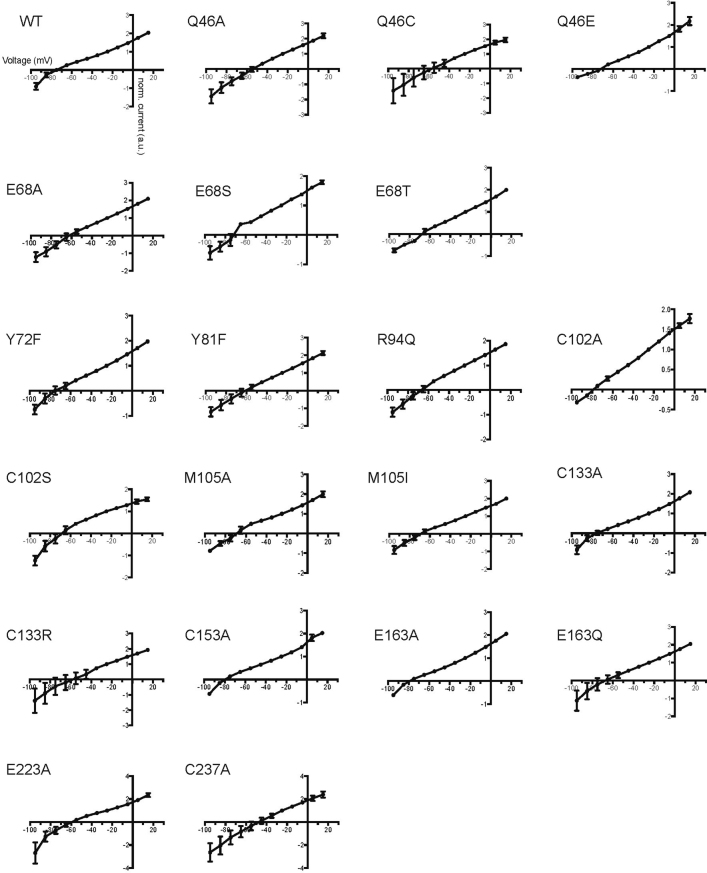
Extended Data Fig. 7. Current–voltage (I–V) relationships of wild-type GtACR1 and mutants.
The I–V relationship between −95 mV and +15 mV was determined from the single current amplitude at the indicated potentials. Each measurement is normalized to the current amplitude measured at −25 mV. Data are mean and s.e.m. n = 10 for WT and C237A, 8 for E223A, 6 for Q46C, E163A and E163Q, 4 for E68S, E68T, C102S and M105I, and 5 for the rest.

